


Step by step instructions
Purpose: Pointwise comparison of two images (e.g. dose map vs. treatment plan).
2D image comparison
2D means the client image (plan) is provided as single 2D image.
|
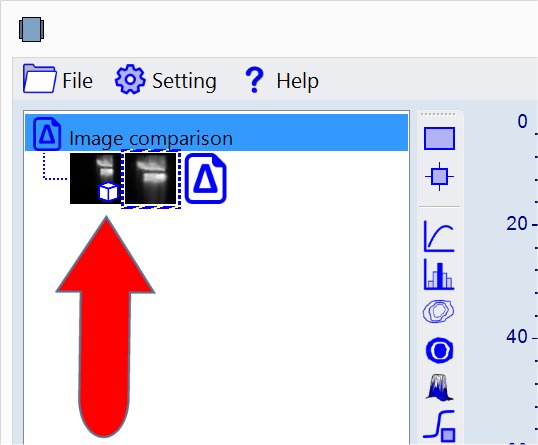
1. Add 'Image comparison' task to the document - right click task list as shown below and select 'Load bitmap'. 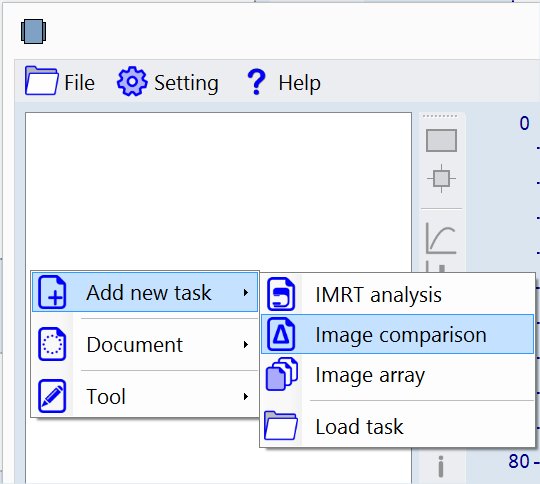
|
|
2. Load client (dose map) image - right click client icon as shown below. File name: 'Example Comparison Client (dose map).tif'. 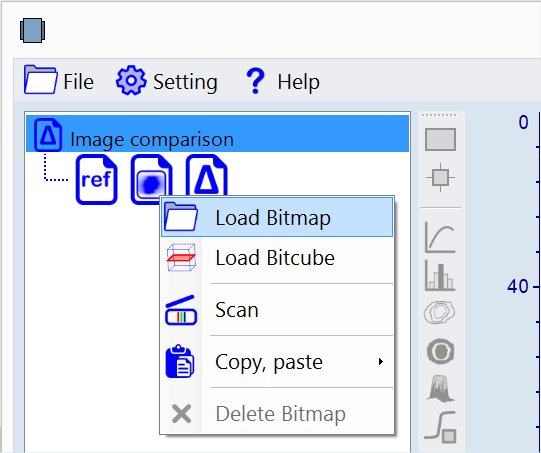
|
|
3. Load reference (plan) image - right click reference icon
|
|
4. Select 'Image comparison' tool - use tool selector underneath task list Or right click task list as shown below. 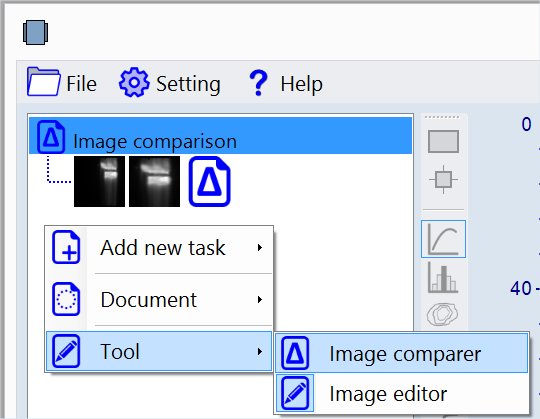
The OC screen should look now as shown below - Cyan colored areas present the reference image data (dose map) and the Red colored areas the client image (plan). 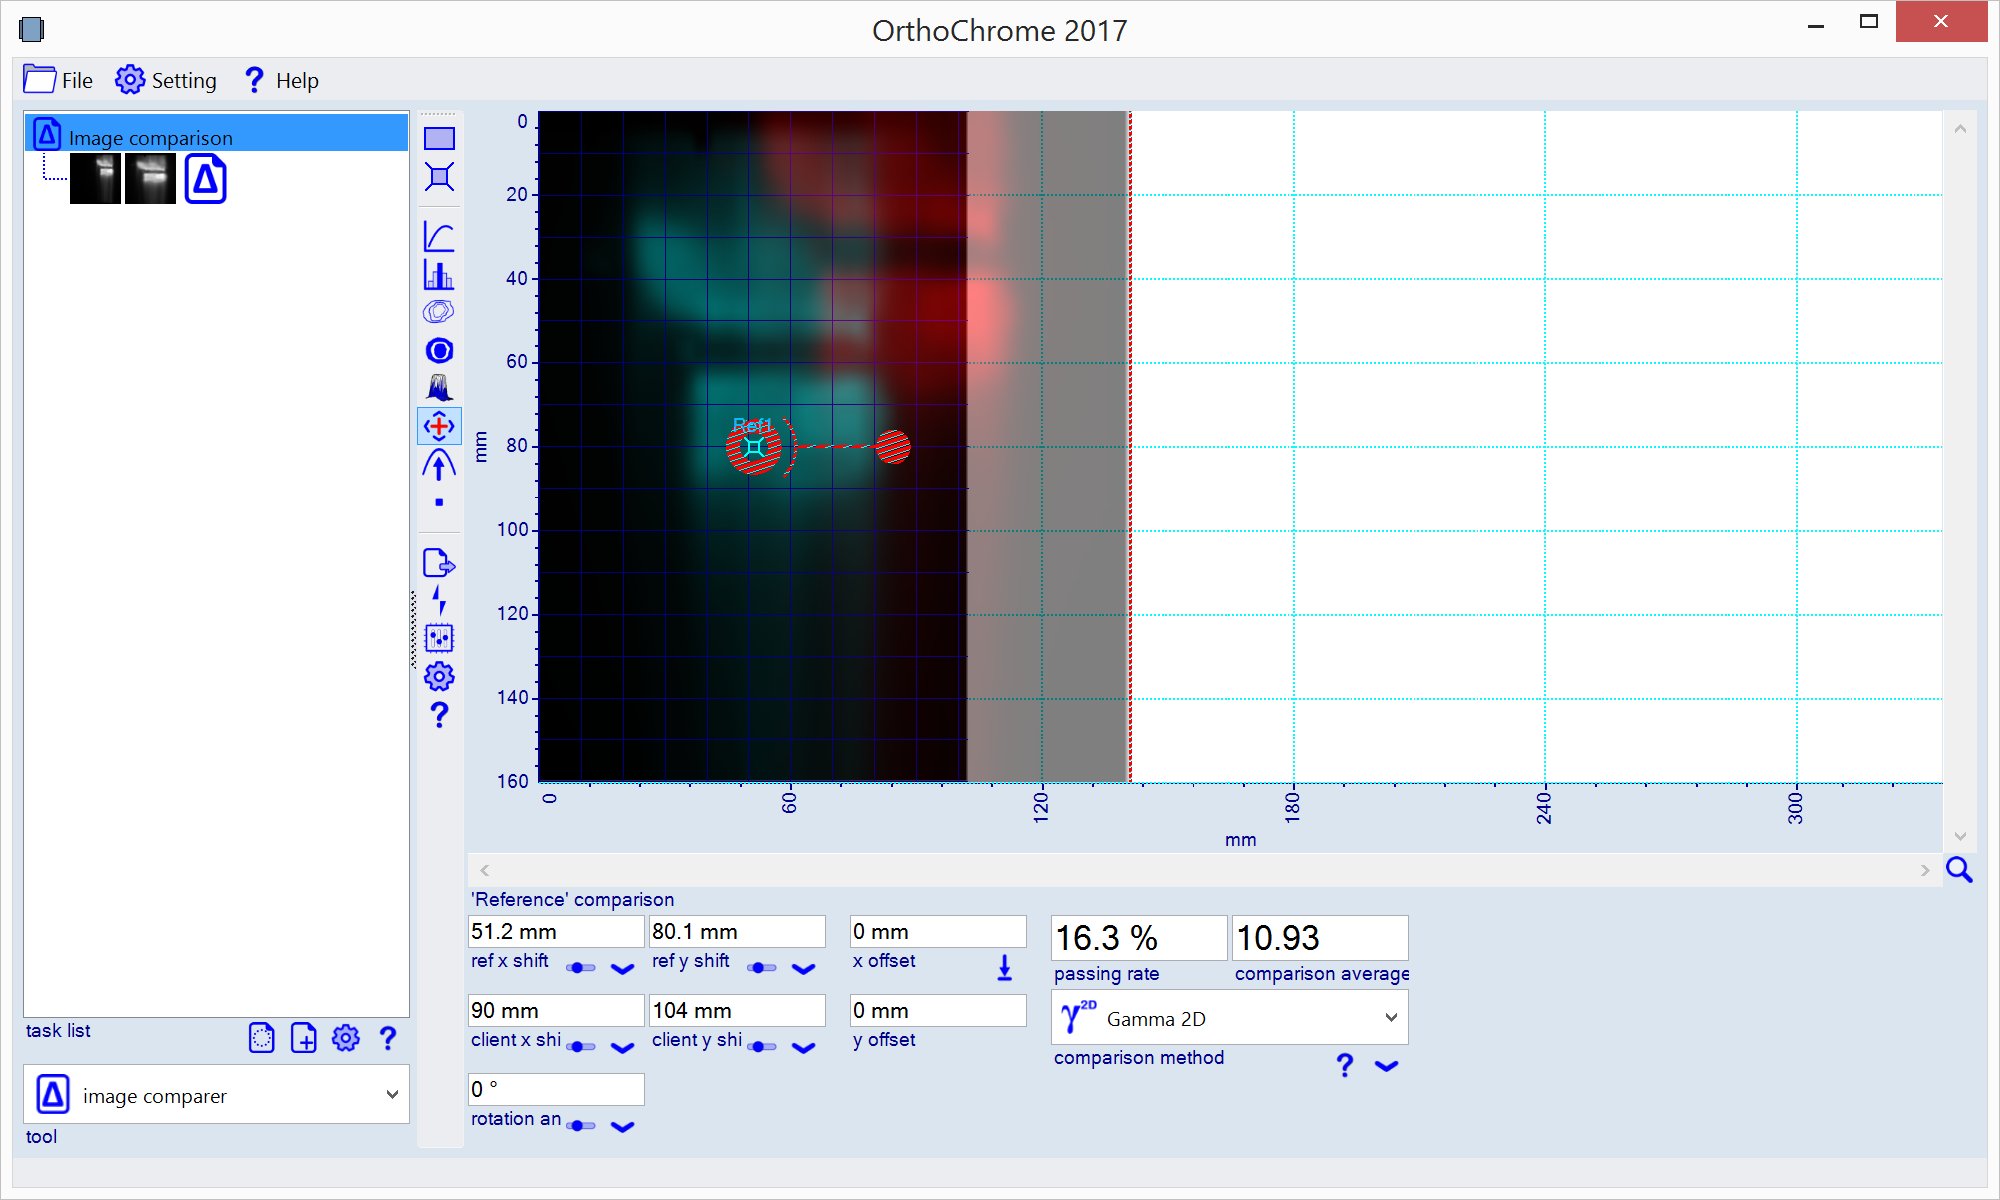
|
|
5. Initial registration of the images - right click the chart area and select 'Match reference and client value centers'
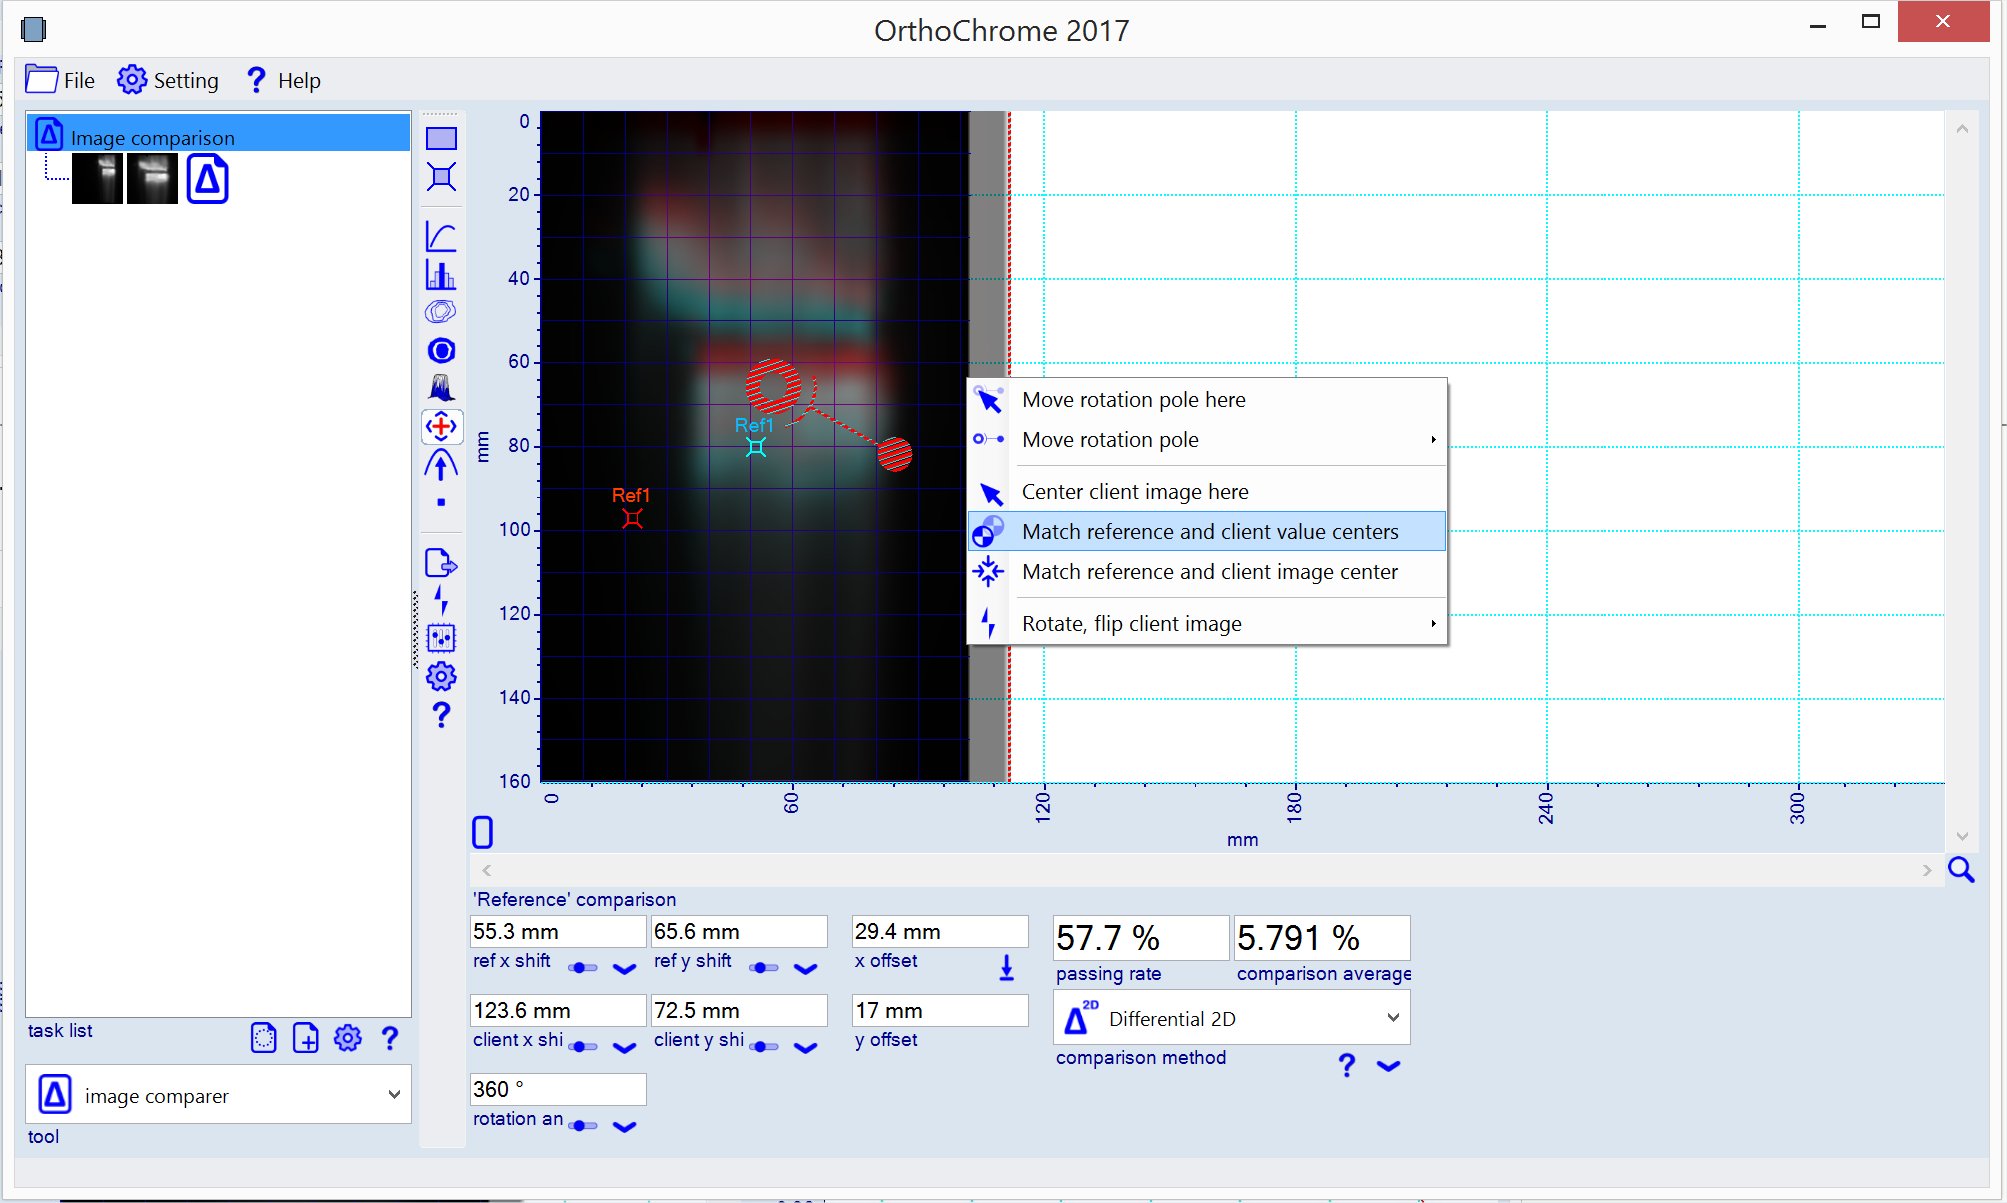
There are alternative ways for the initial fit:
|
|
6. Zero the offset (optional) - push
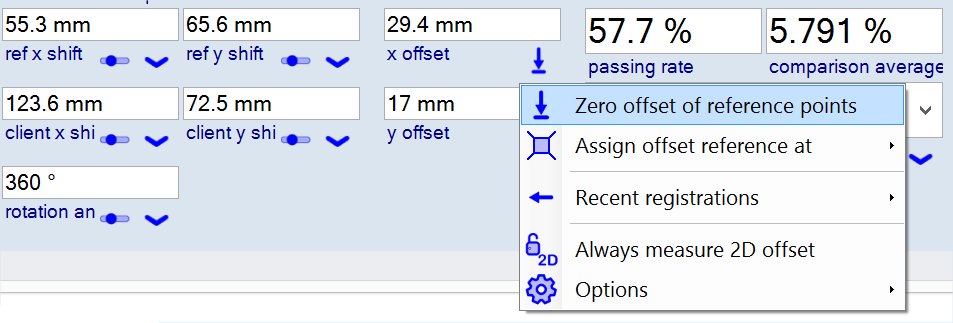
The offset value is zeroed by projecting the offset reference points at reference image (dose map) to the client image (plan) using registration data. |
|
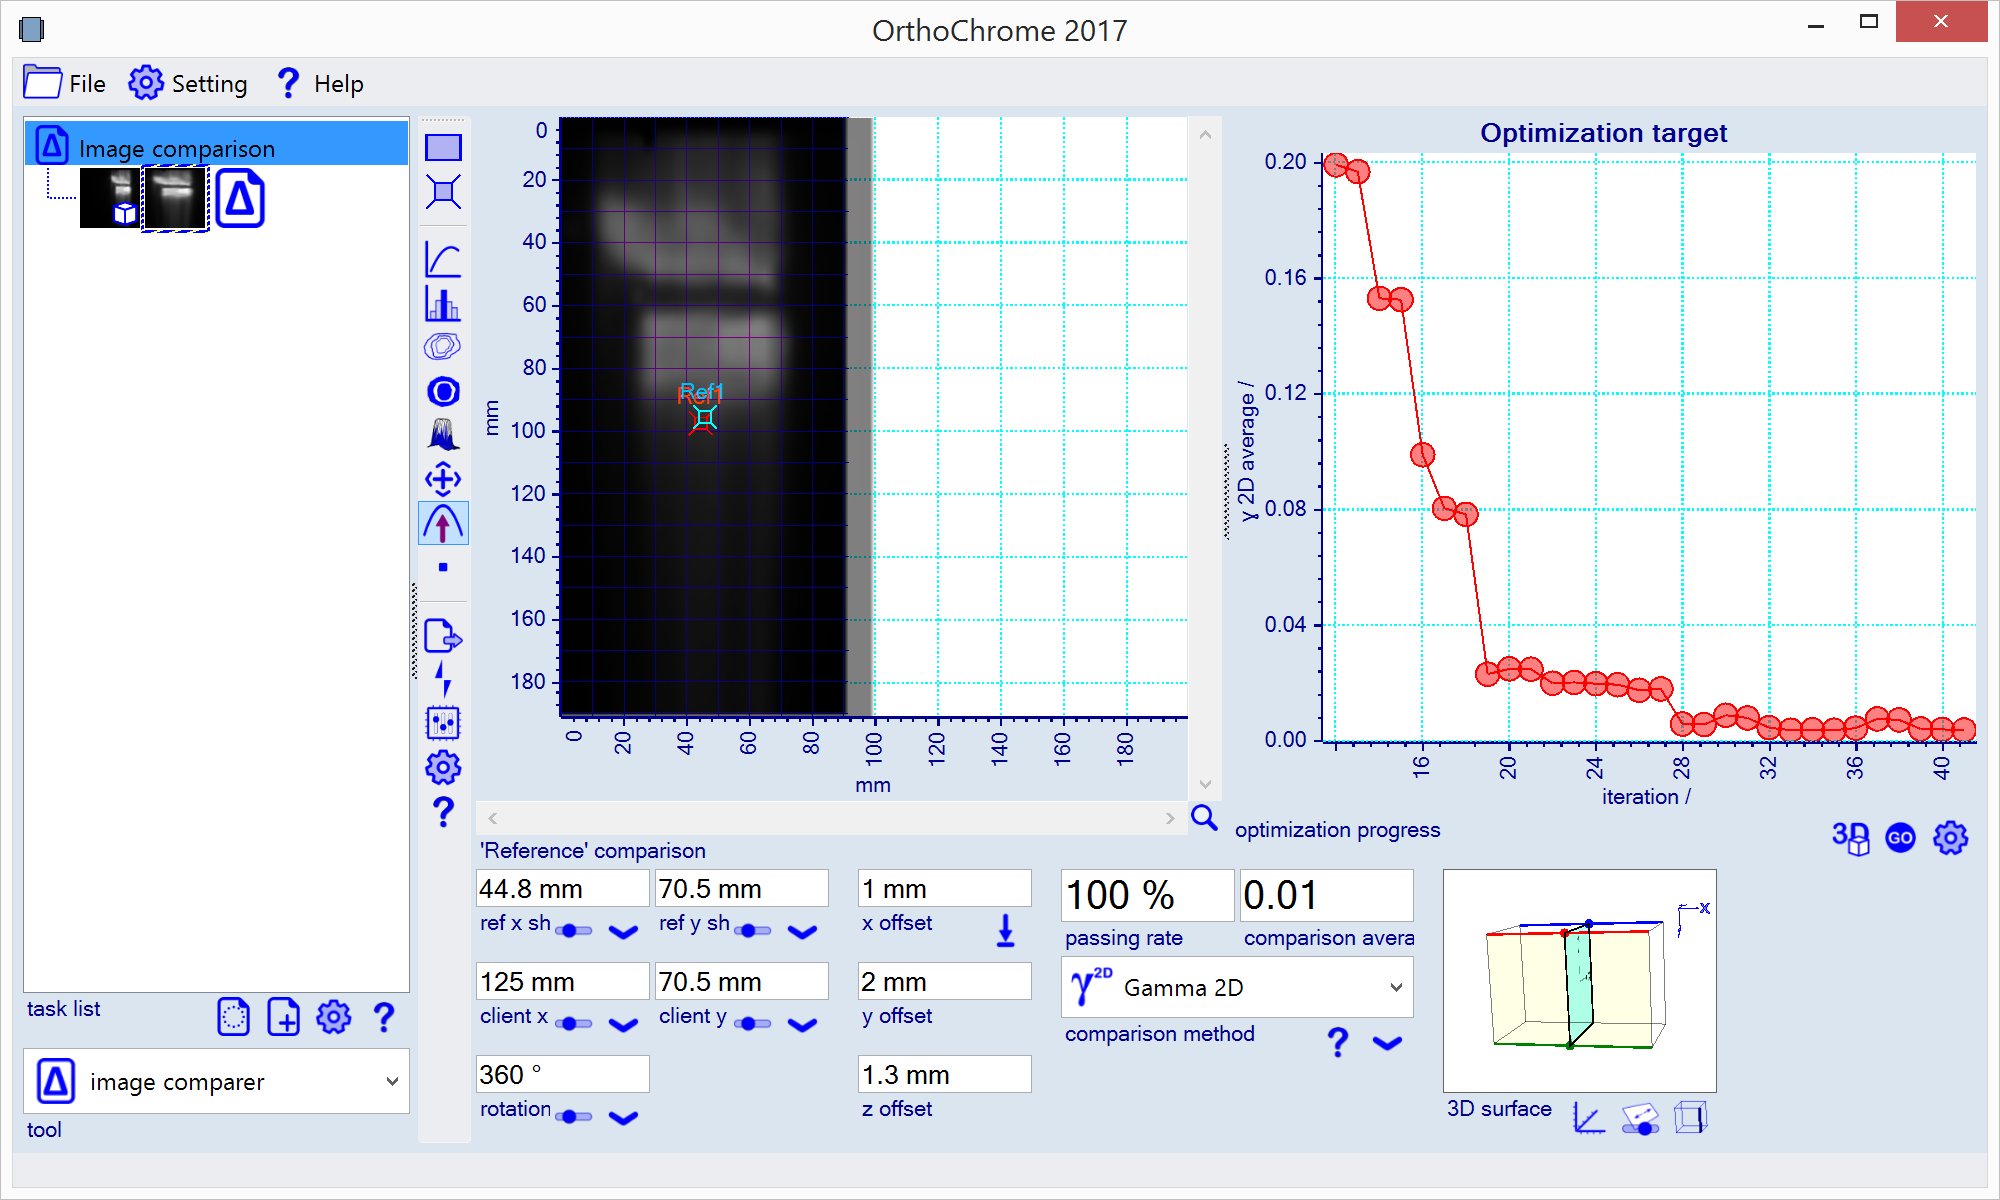
7. Select the optimization tool icon
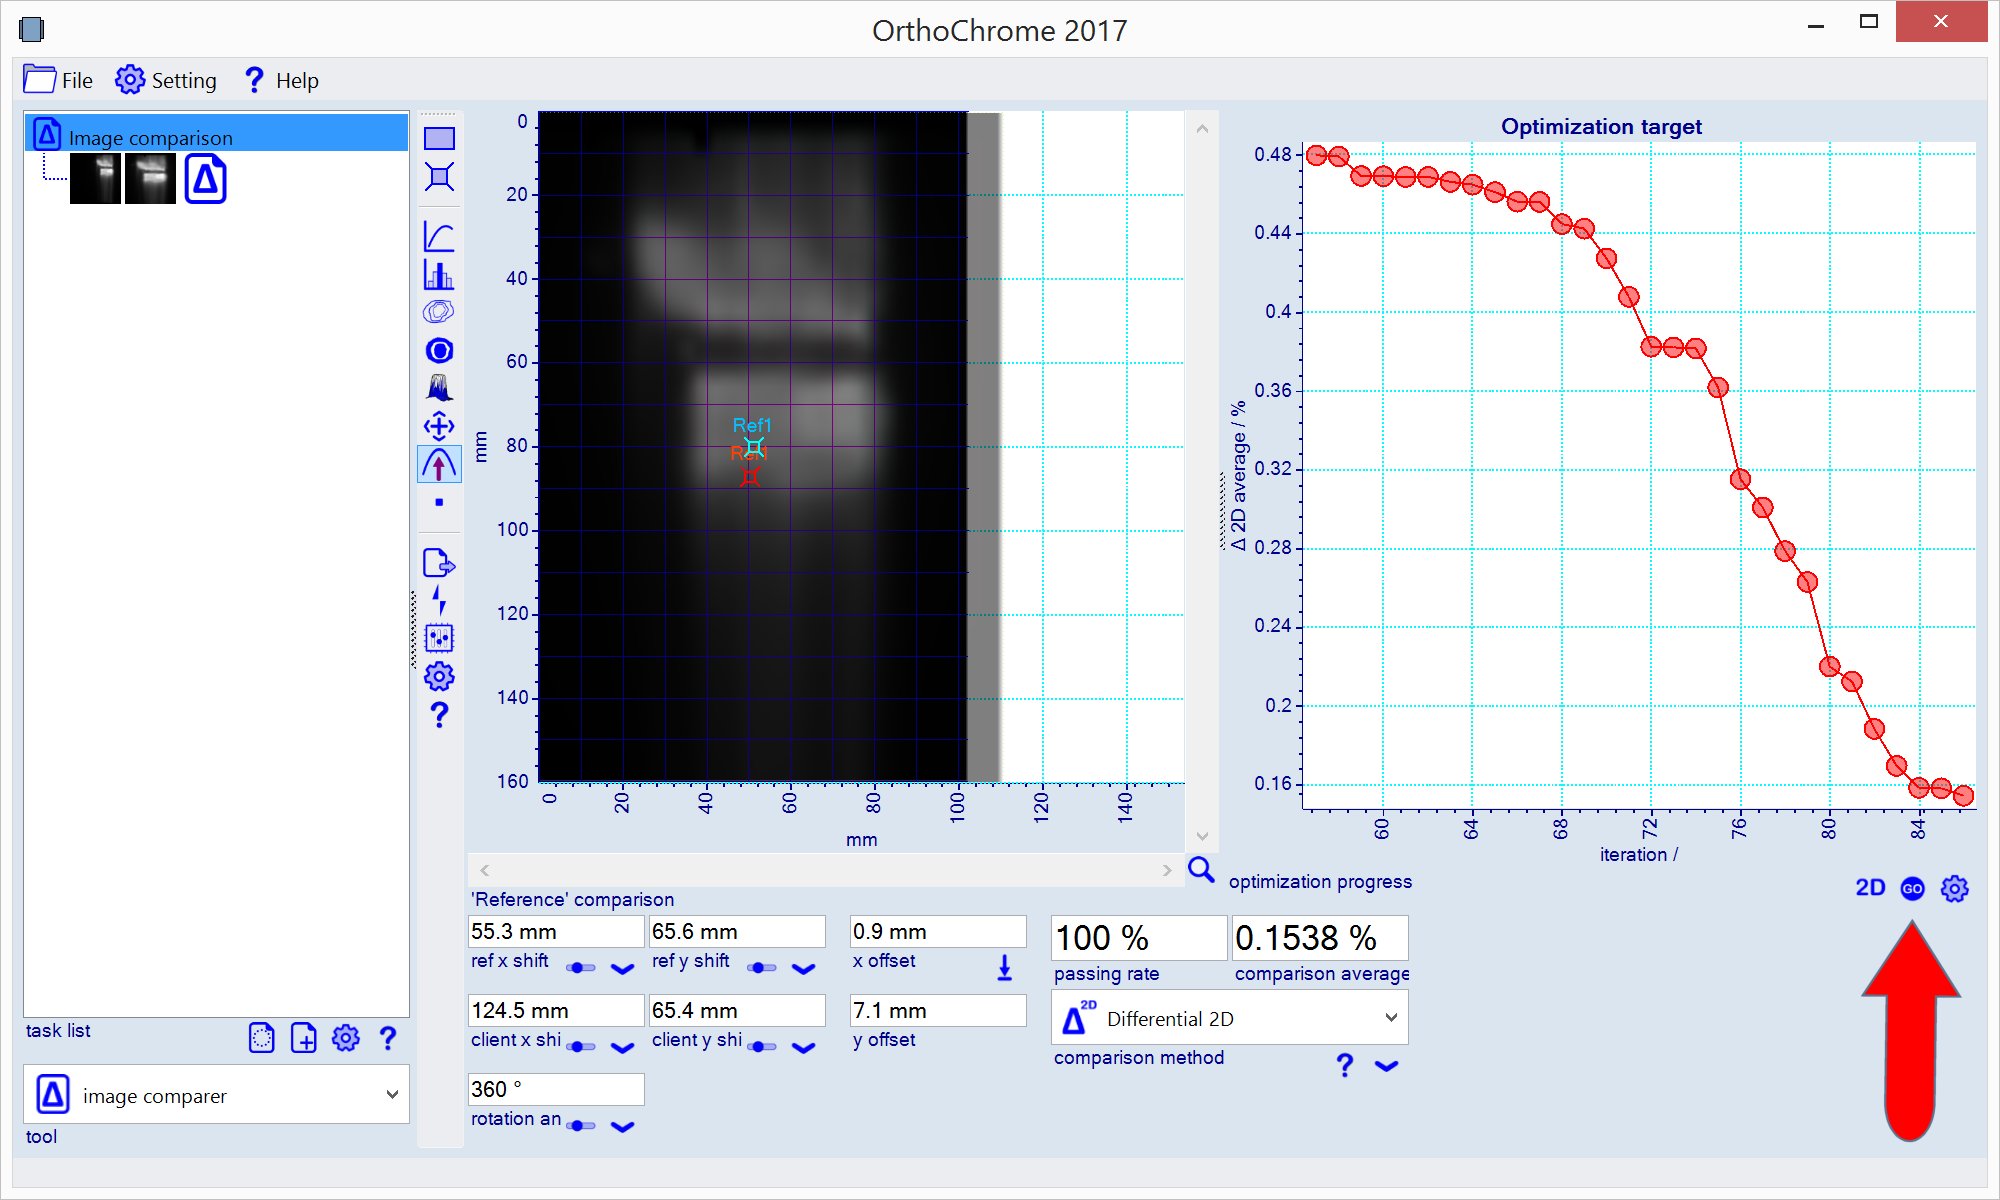
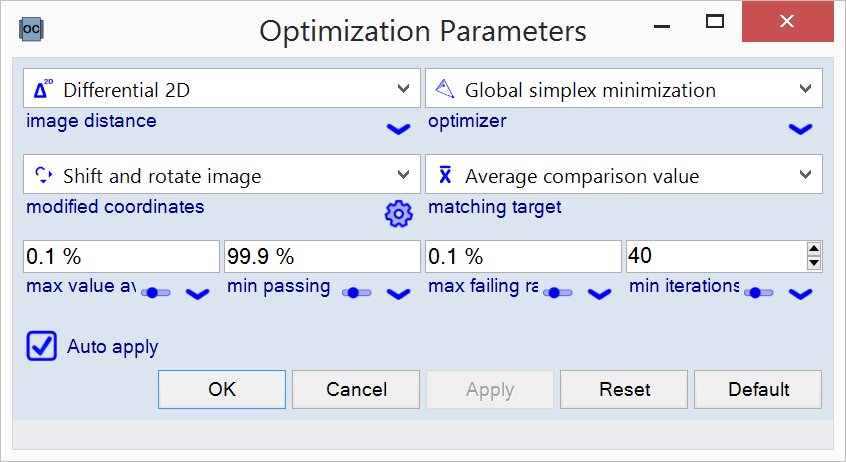
Optimization process stops when optimization criterias are met - click
|
|
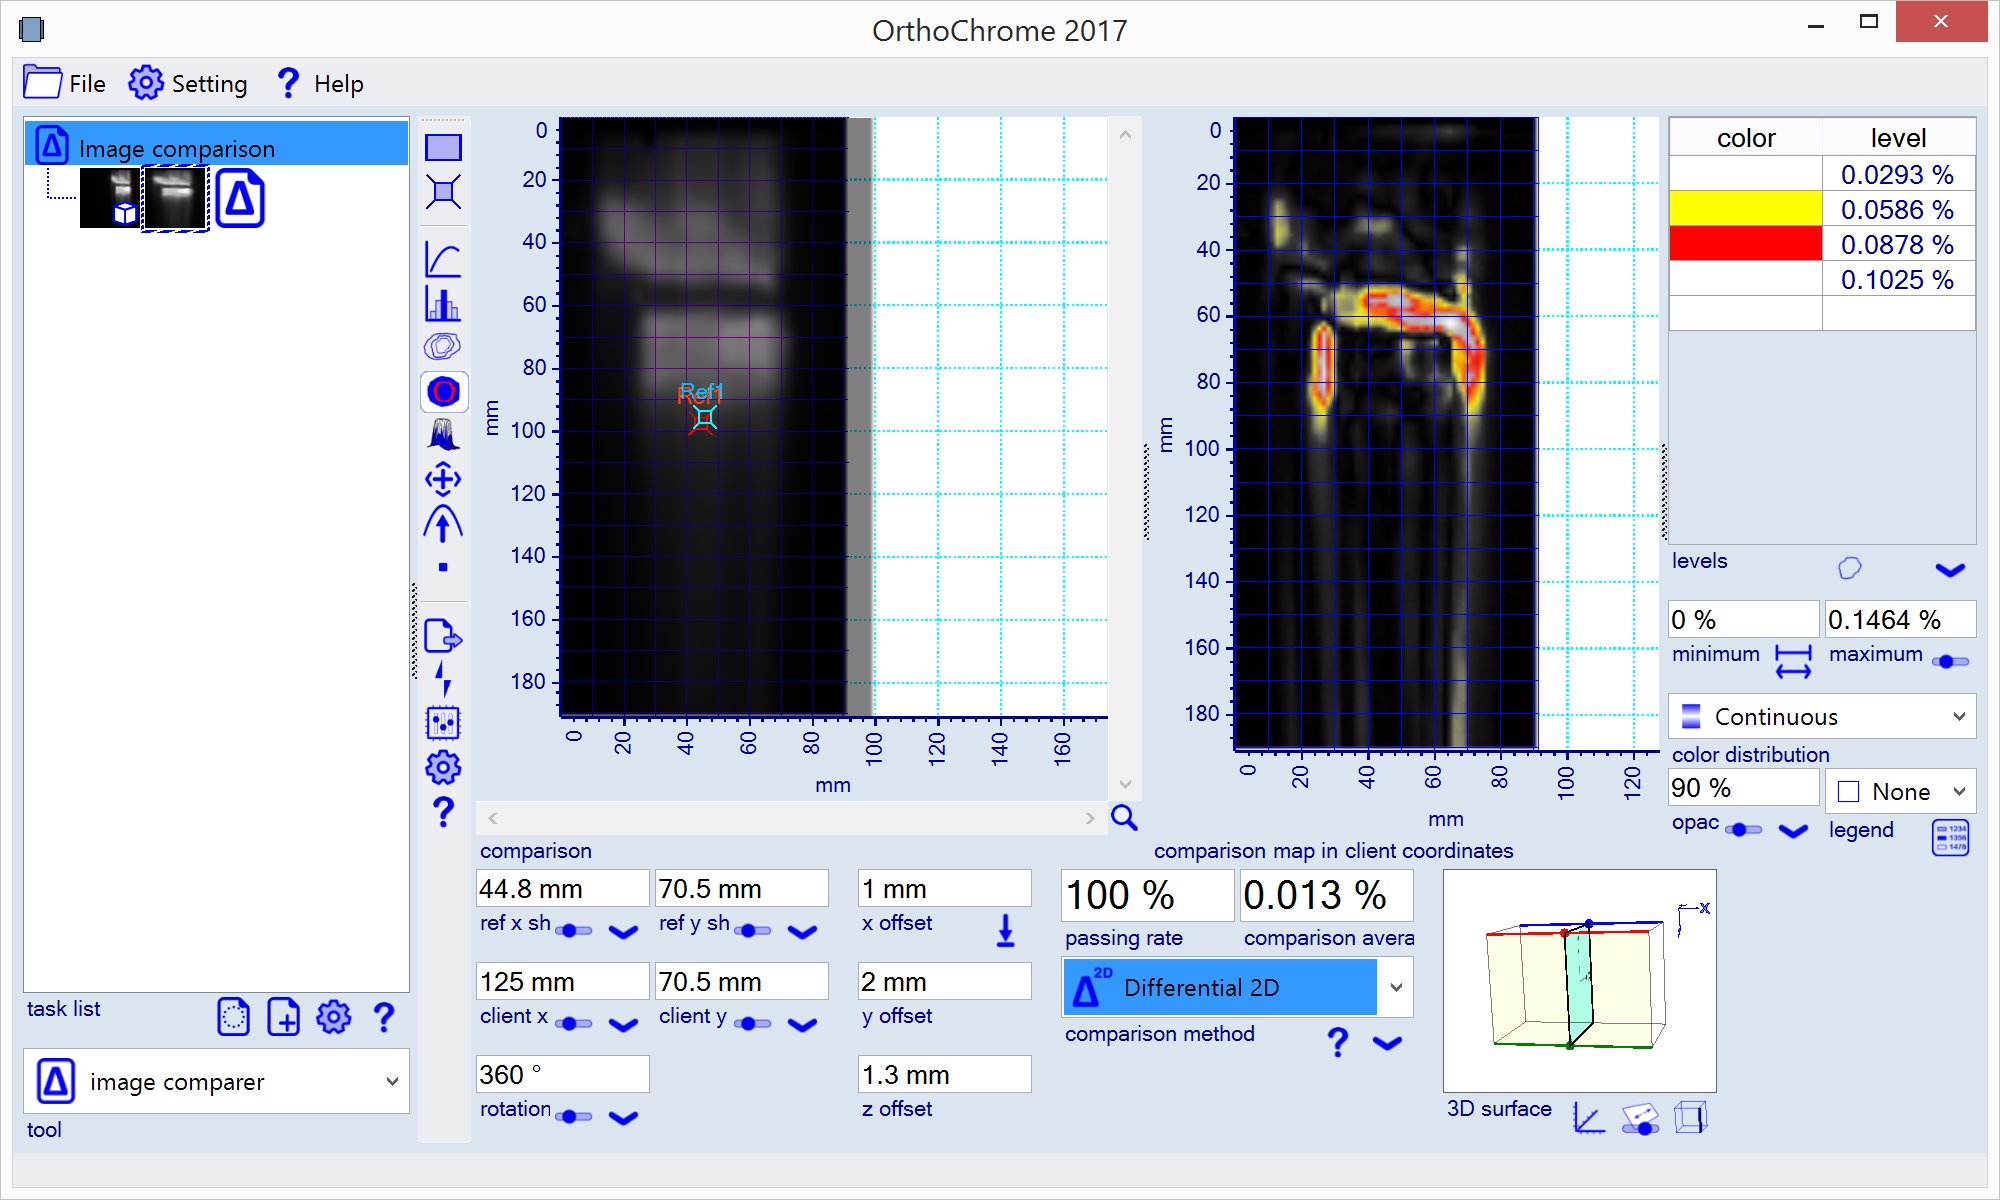
8. Select any of the available tool to evaluate the comparison - e.g. select isomap tool
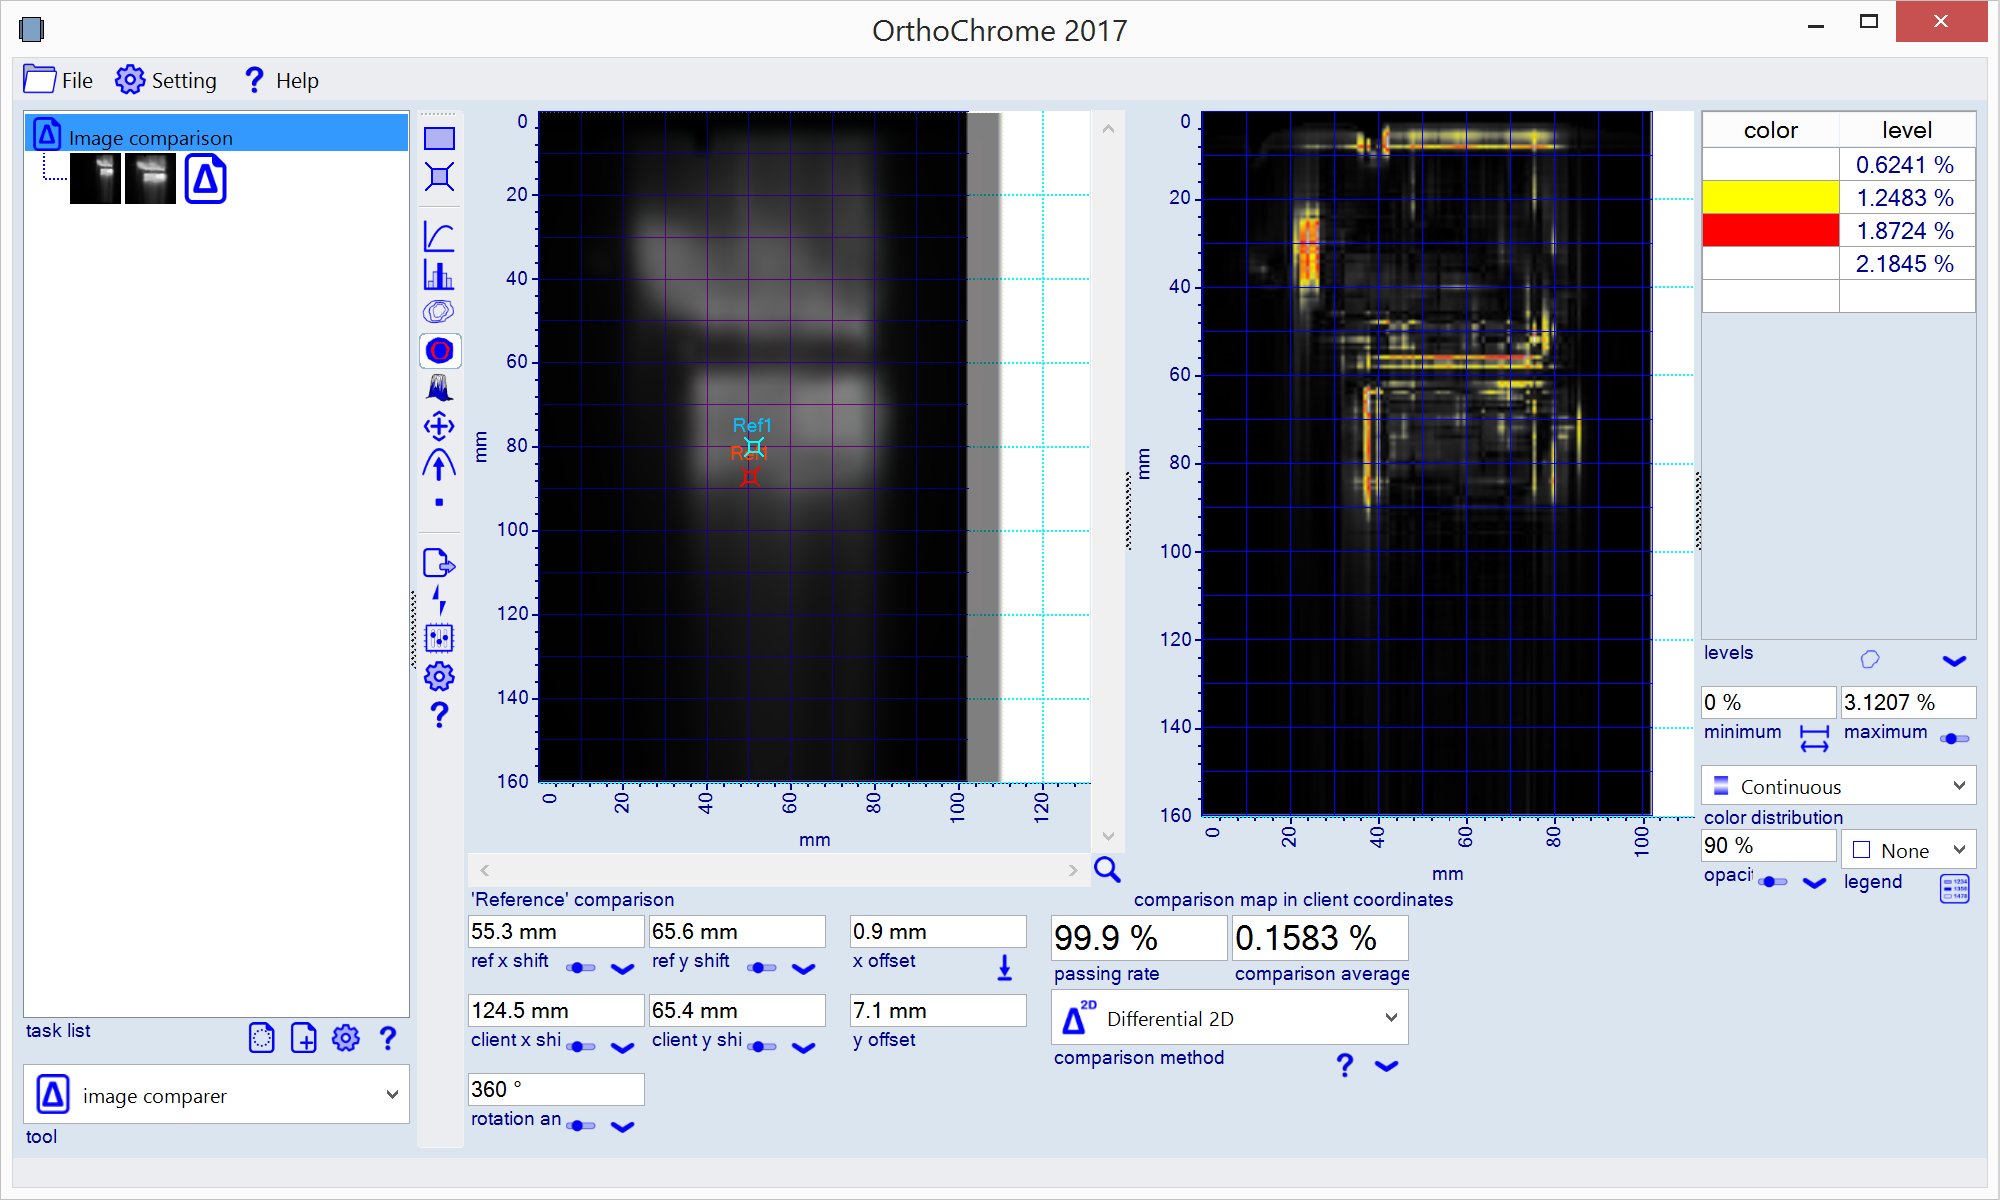
|
-- end of 2D image comparison --
3D image comparison
3D means the client image (plan) is provided as 3D bitcube data and the comparison optimization finds also the best plan position inside the 3D bitcube..
|
1. Add 'Image comparison' task to the document - right click task list as shown below.
|
|
2. Load client (dose map) image - right click client icon as shown below. File name: 'Example Comparison Client (dose map).tif'.
|
|
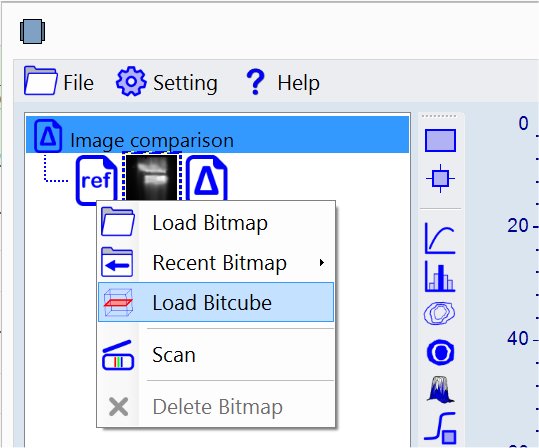
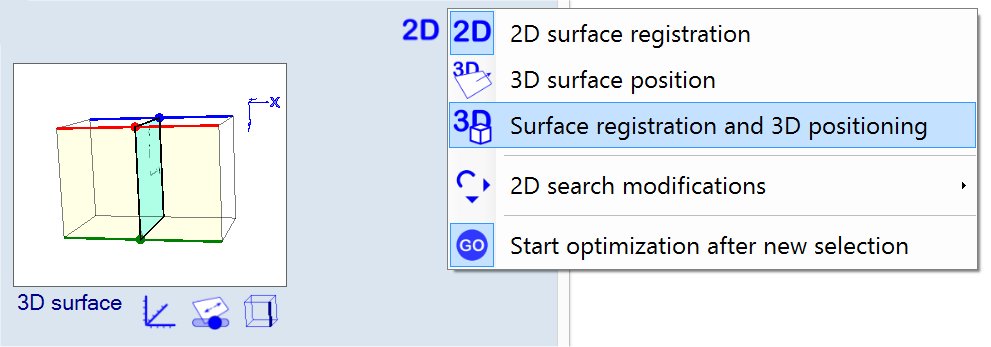
3. Load reference (plan) 2D bitcube data - right click reference icon
|
|
4. Select 'Image comparison' tool - use tool selector underneath task list Or right click task list as shown below. 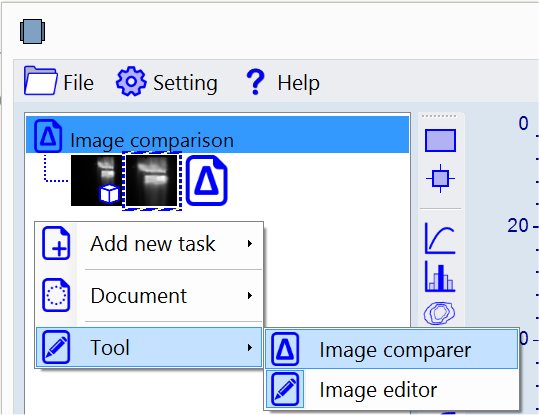
The OC screen should look now as shown below - Cyan colored areas present the reference image data (dose map) and the Red colored areas the client image (plan). 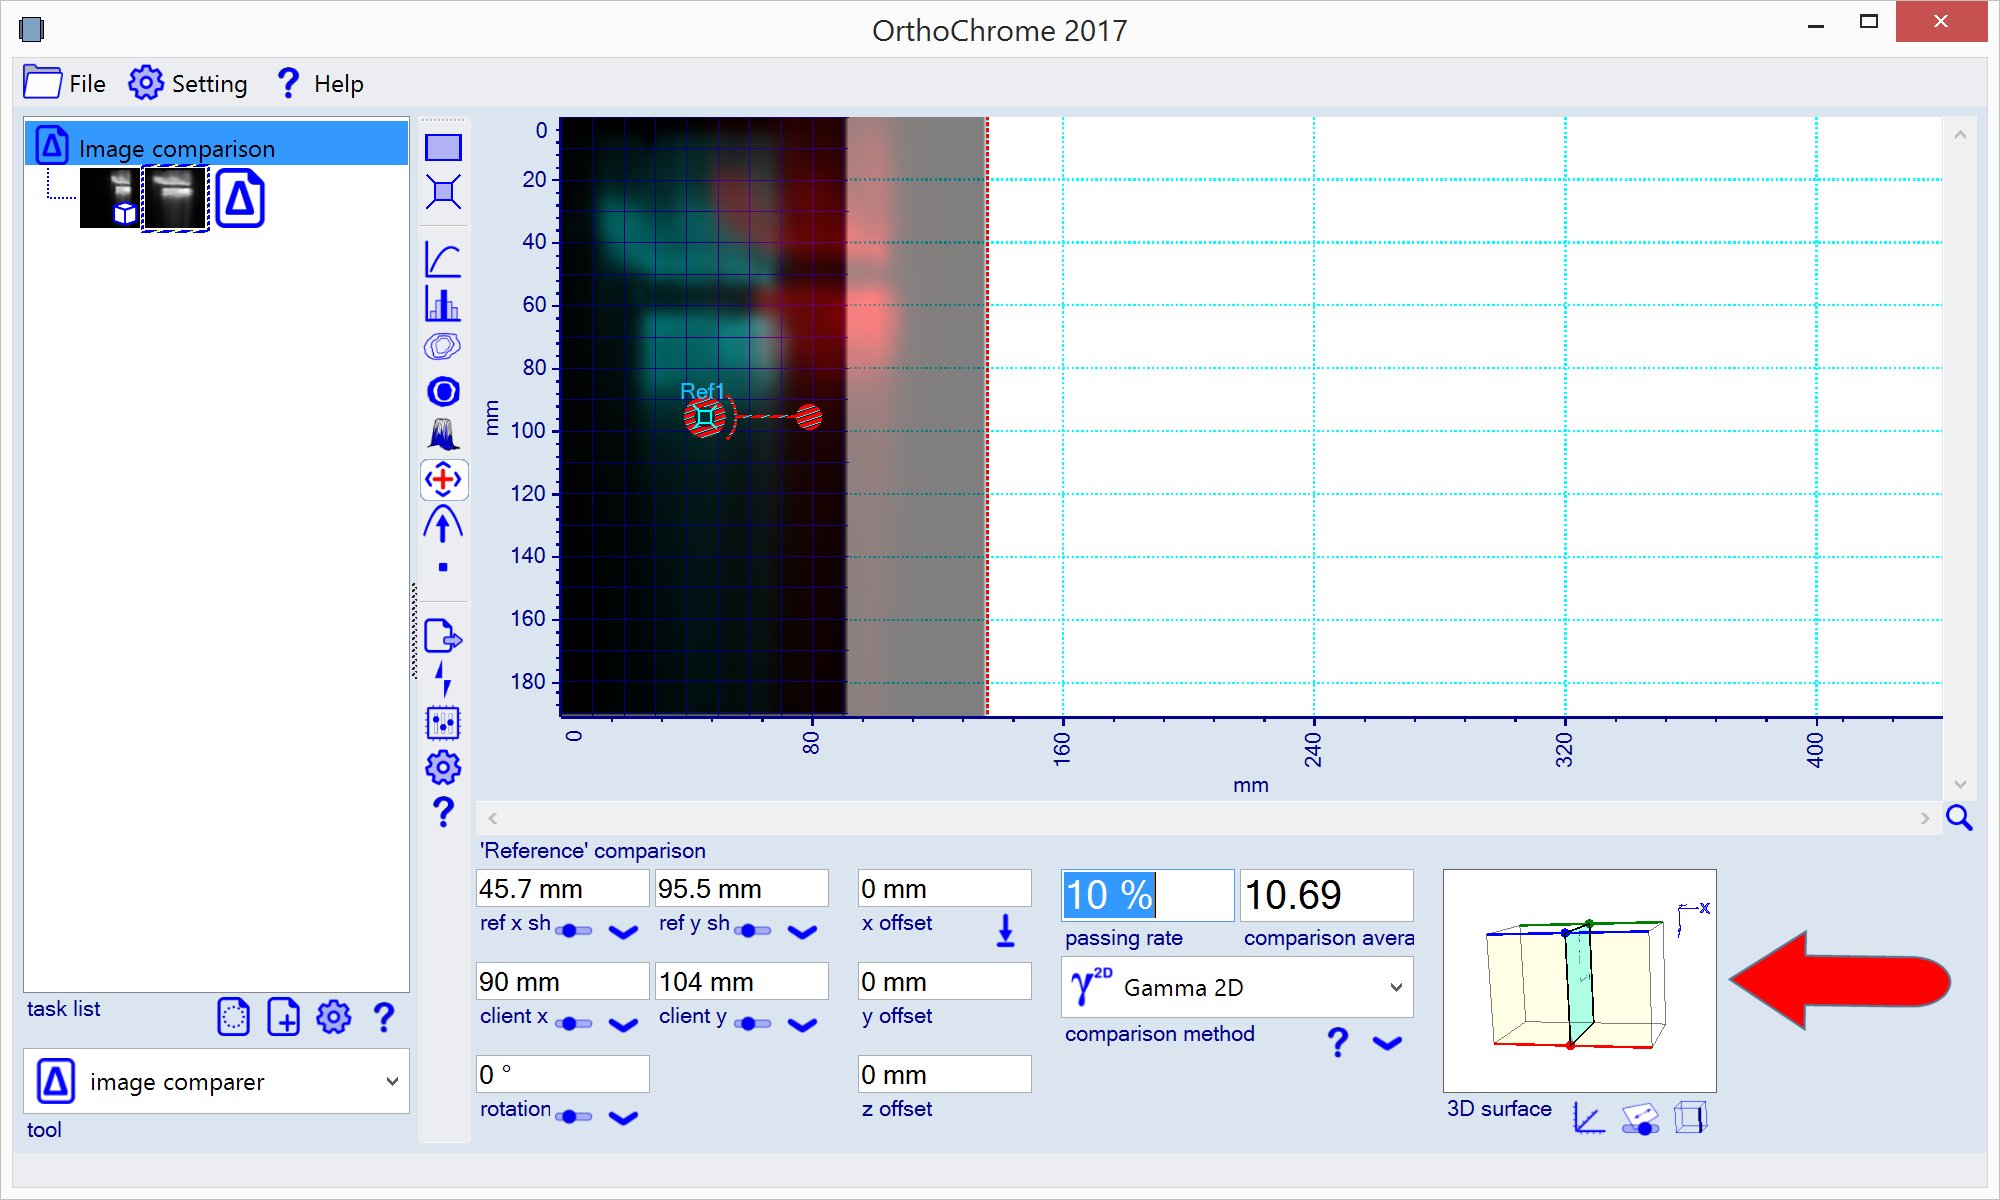
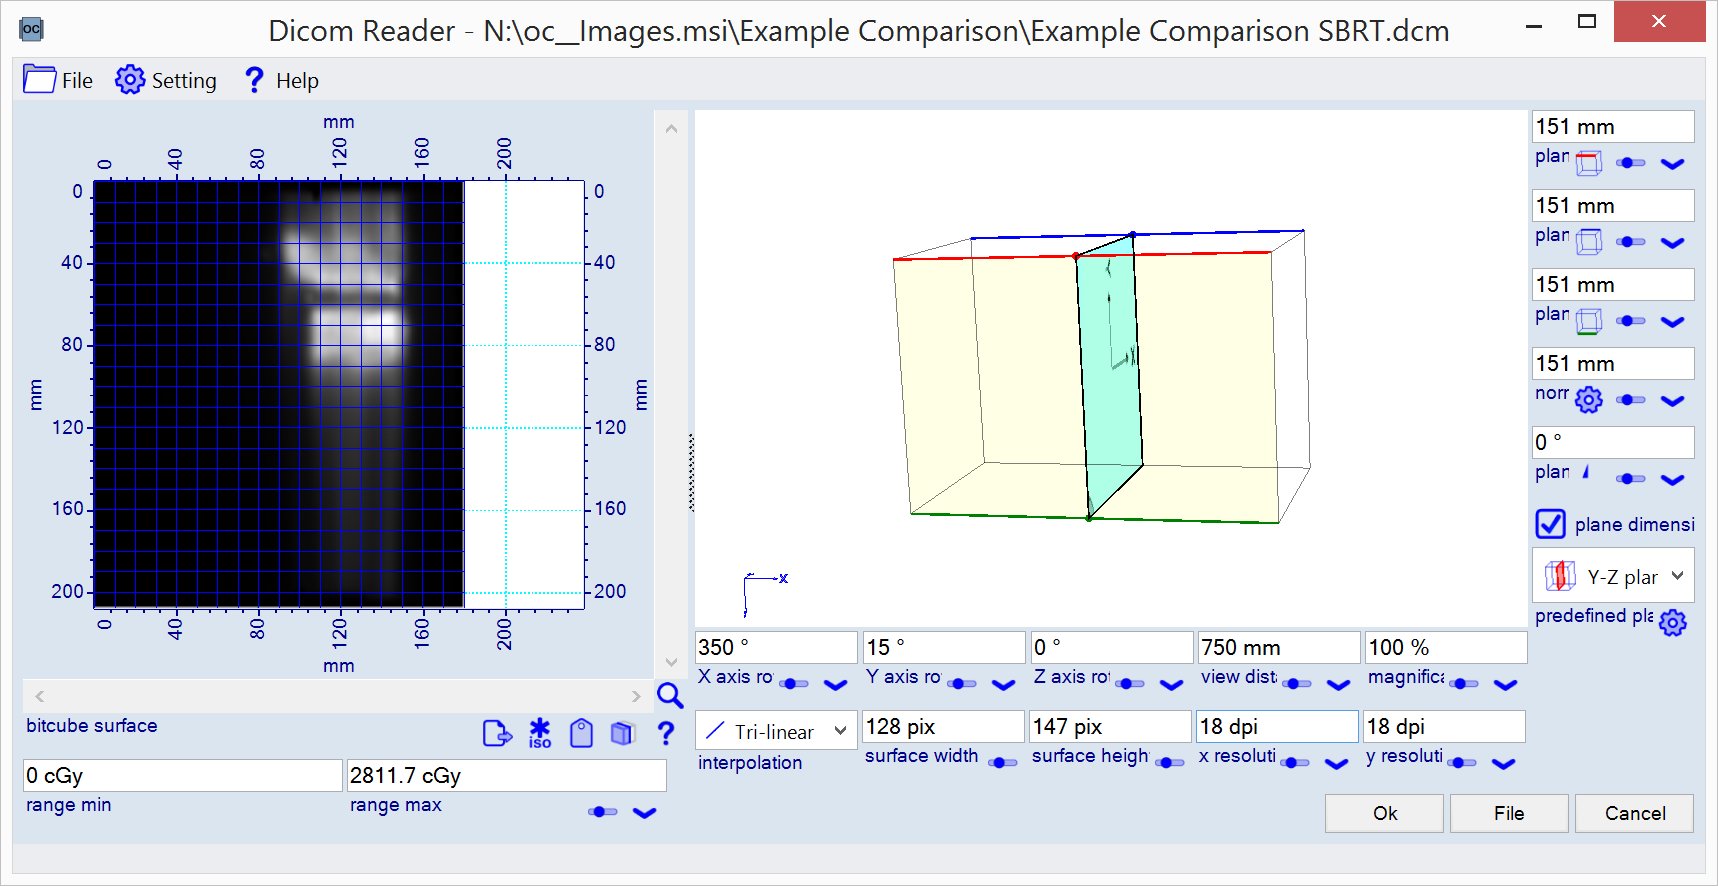
Note the 3D chart showing the positioning of the plan surface (plane) inside the data cuboid. |
|
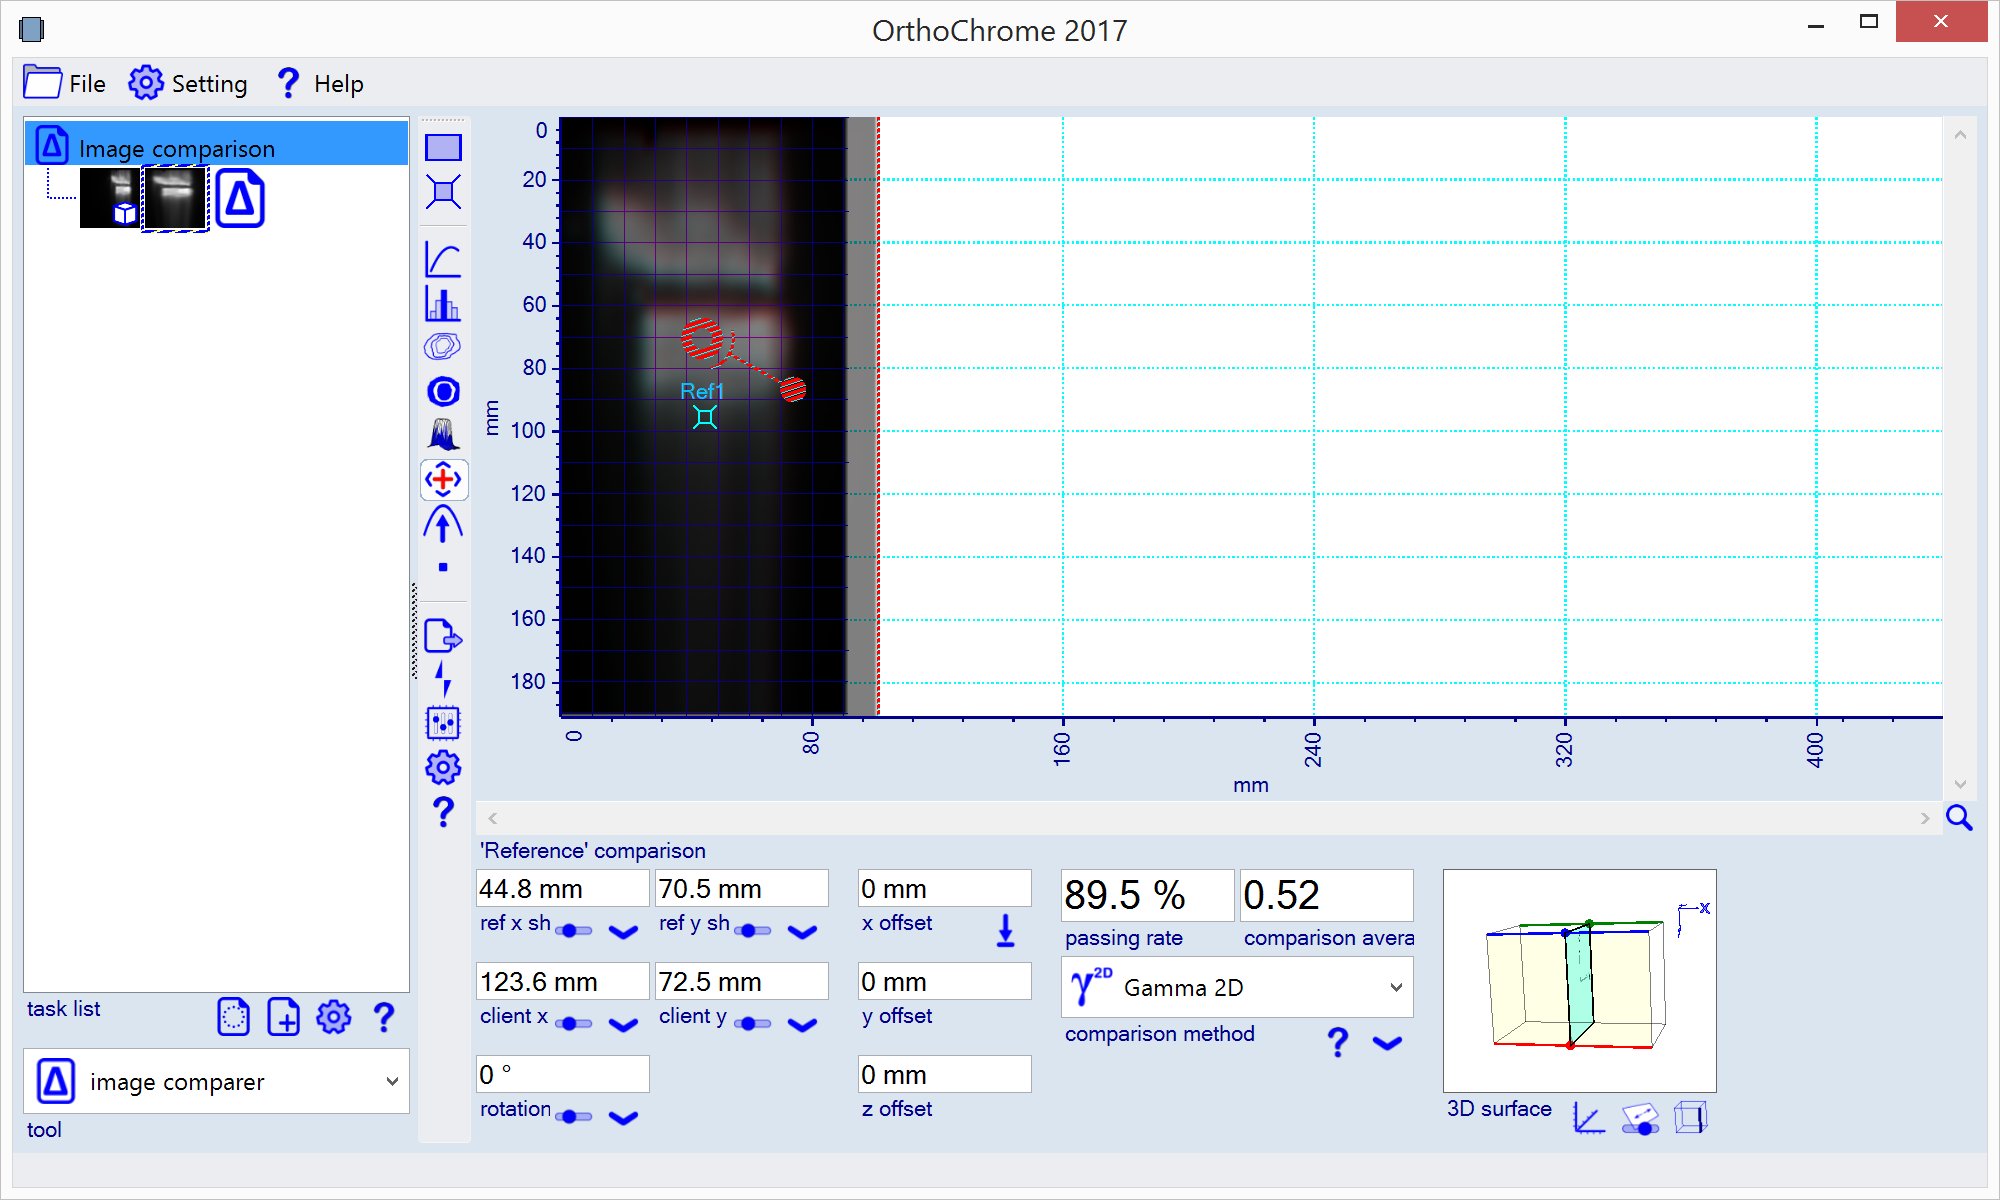
6. Initial registration of the images - right click the chart area and select 'Match reference and client value centers'

There are alternative ways for the initial fit:
|
|
6. Zero the offset (optional) - push
The offset value is zeroed by projecting the offset reference points at reference image (dose map) to the client image (plan) using registration data. The positioning of the plan surface (plane) in the bitcube stipulates the 3D location of the offset reference points. |
|
7. Select the optimization tool by clicking the
Optimization process stops when optimization criterias are met - click
See parameter settings for more details . Note: The x axis direction is the normal direction of the plan and offset x component is 1 mm, what is the offset between plan surface and dose map plane. |
|
8. Select any of the available tool to evaluate the comparison - e.g. select isomap tool
|
-- end of 3D image comparison --