


 Add task
Step by Step Instructions (Field Calibration)
Purpose: Complete treatment plan analysis with calibration, dose mapping and plan comparison. This example is based on single exposure calibration using a calibration field.
|
Protocol involves one image only!
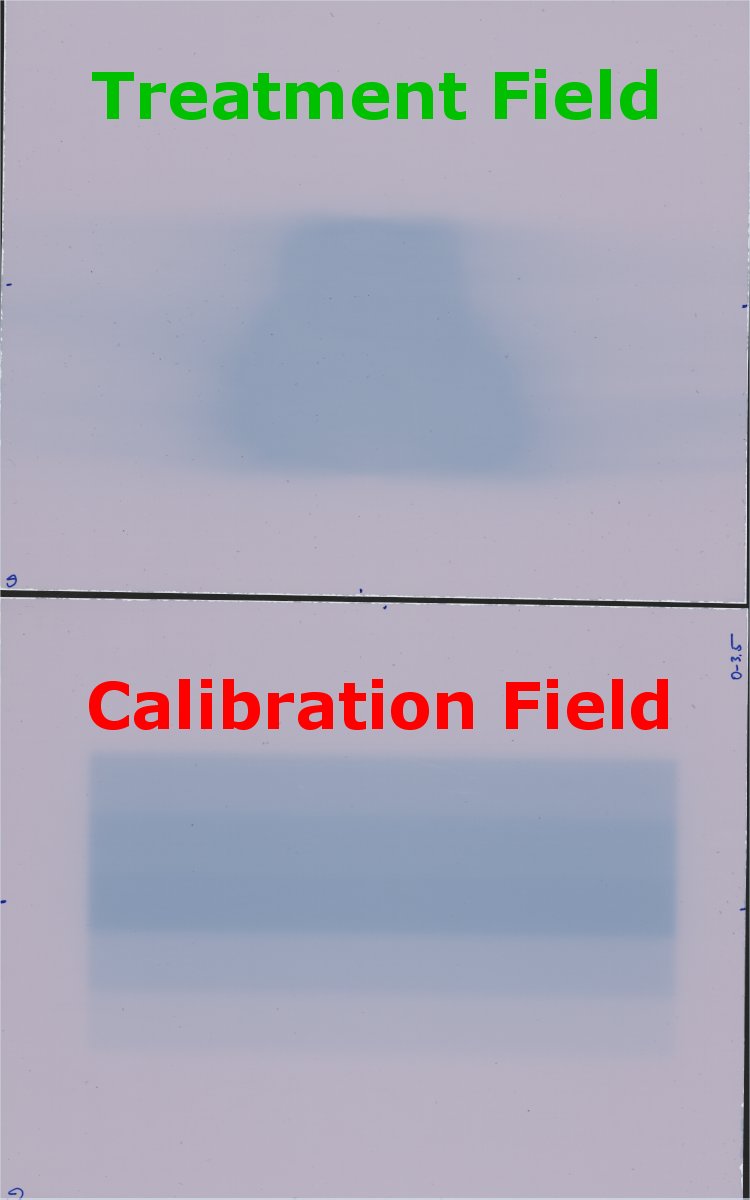
Scanned image must include
|
- Calibration strips exposed to flat fields at several dose levels
- Composite calibration using calibration data on second scan (e.g. many strips with flat field exposure).
Data: Installation folder '.\Data\Example Prostate 250 cGy'.
|
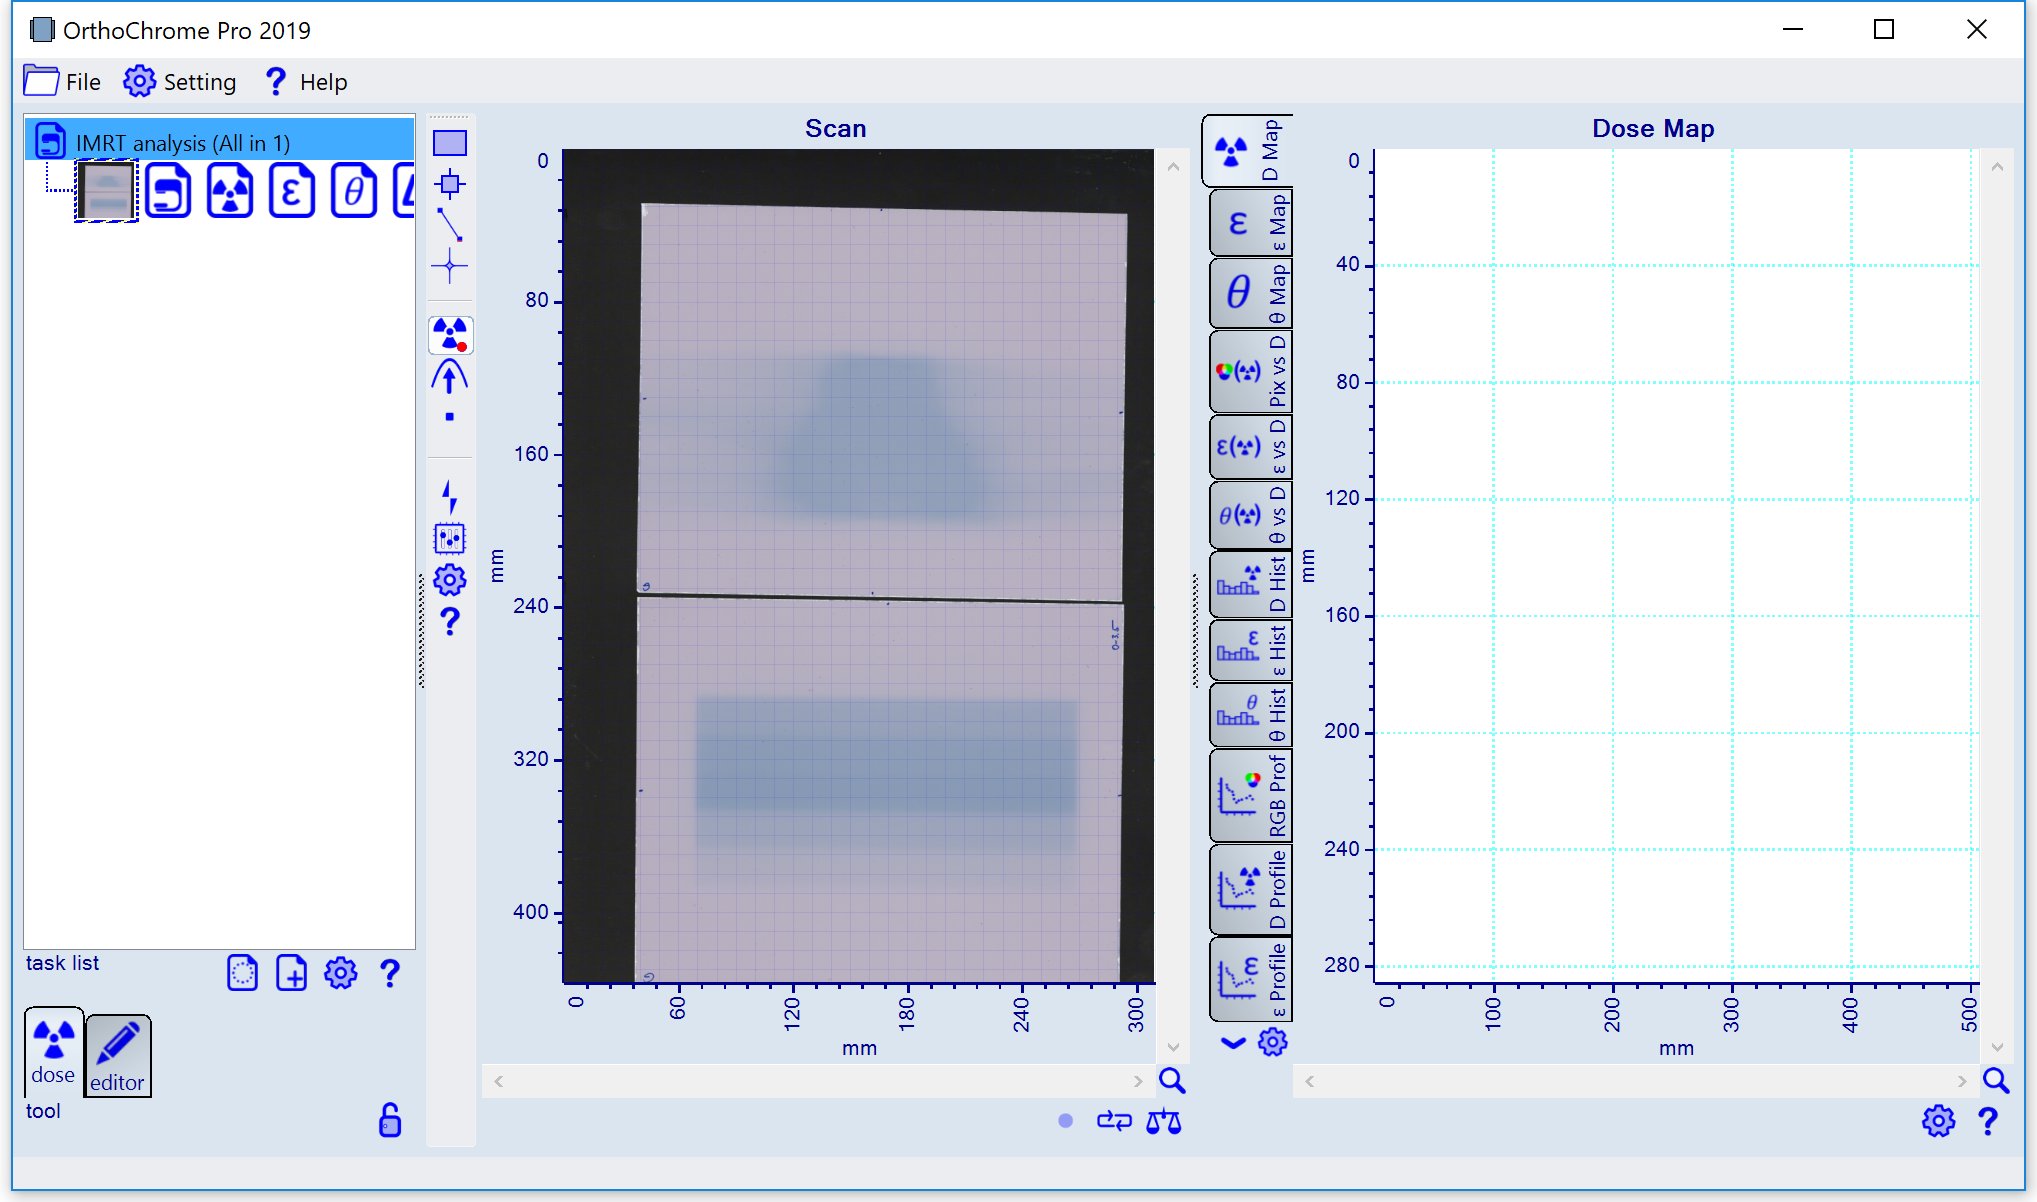
1. Add Task
Add new task 'Treatment analysis' to the document.
Right click
|
|
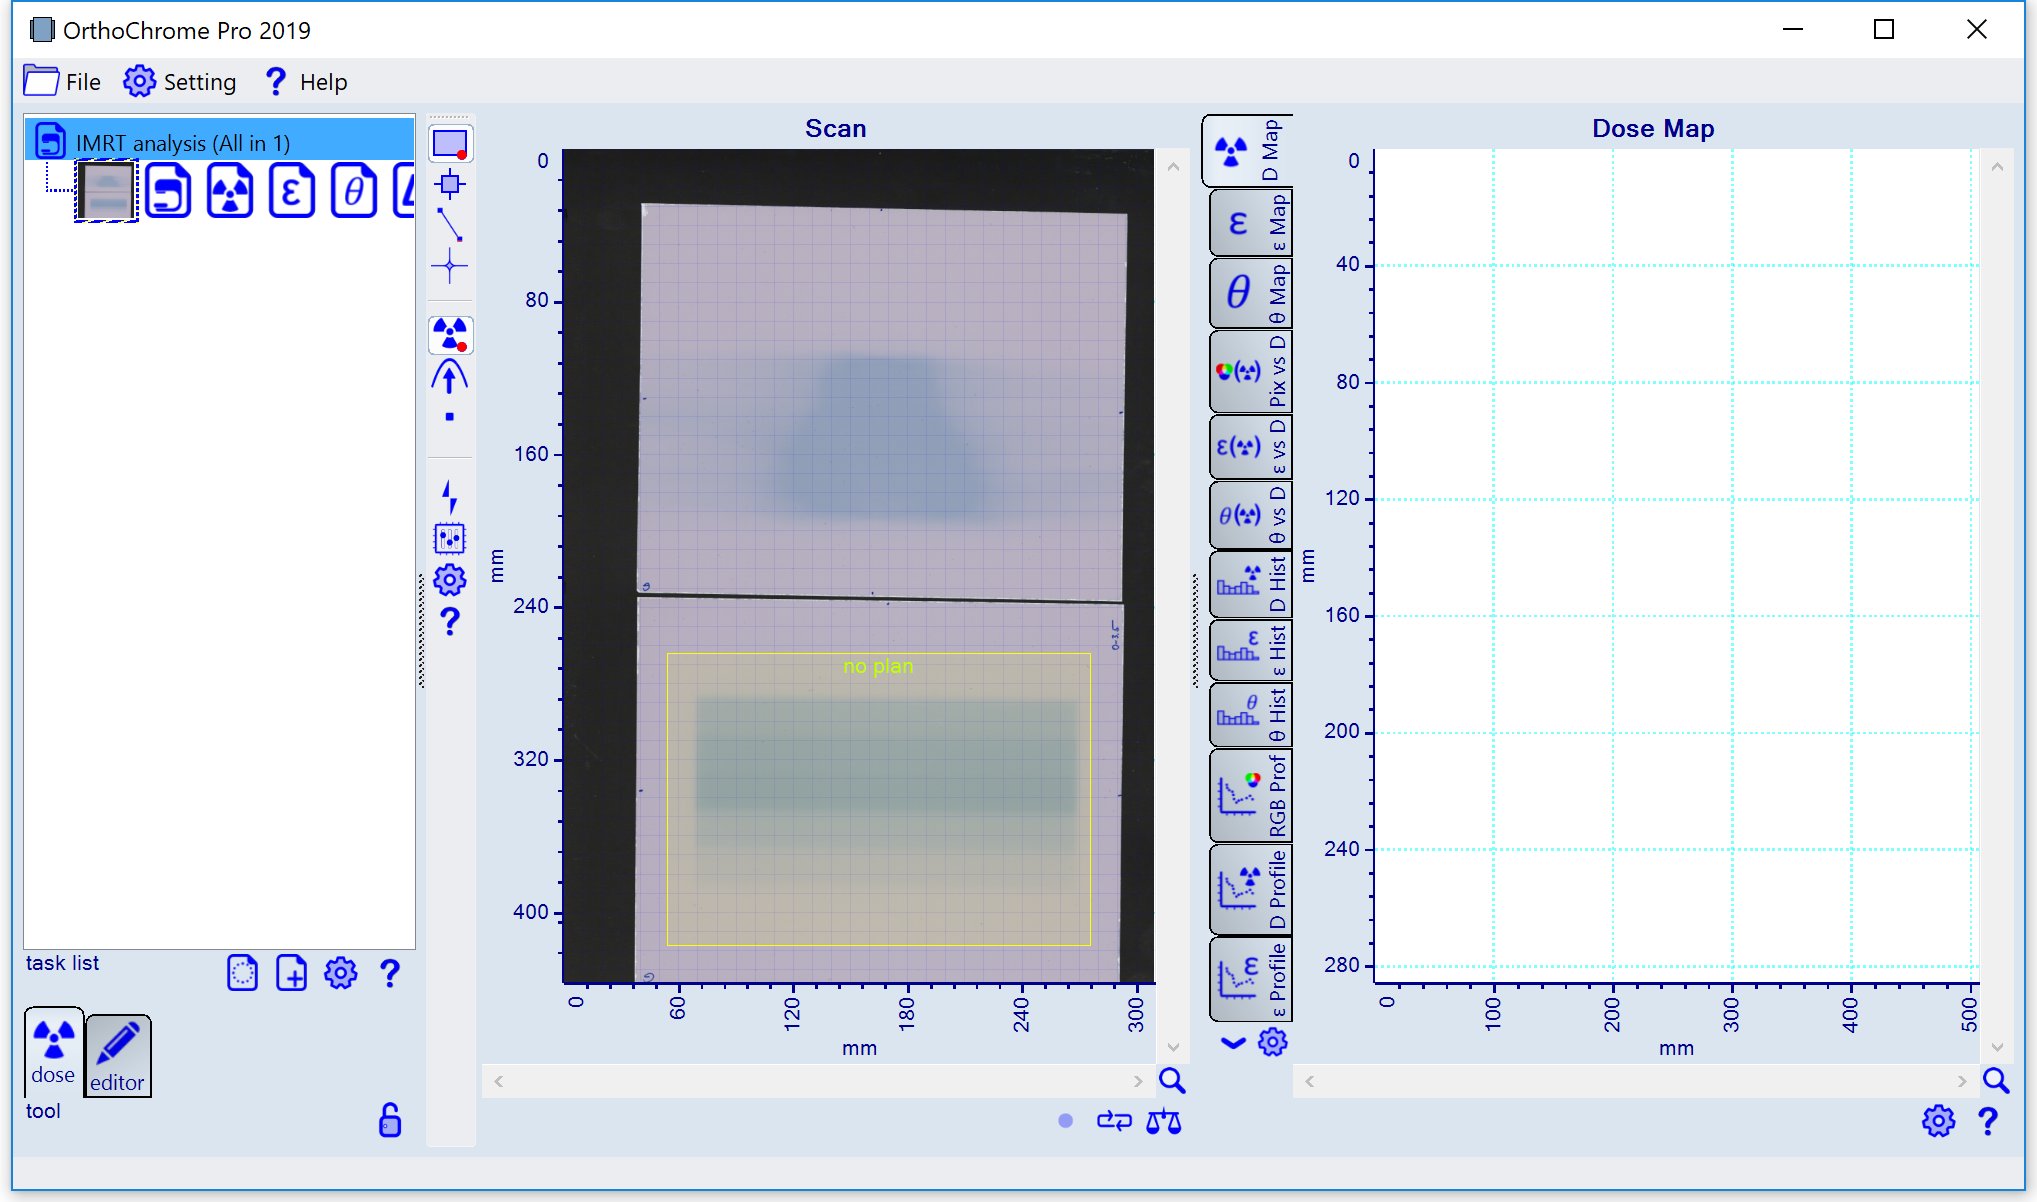
2. Calibration area
Select frame tool
|
|
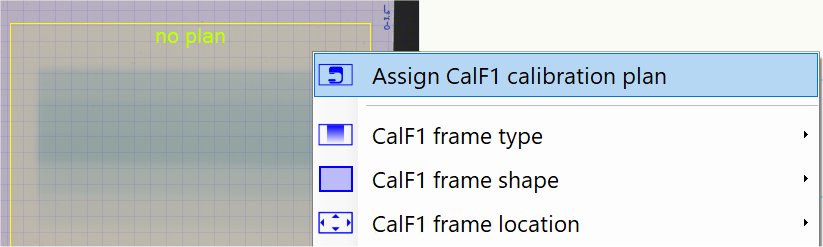
3. Assign calibration plan
Right click inside the drawn frame and select in the context menu 'Assign calibration plan'
|
|
4. Calibration and Dose Map Generation
After the calibration plan is assigned, the calibration and dose map generation starts automatically (enabled by default) indicated by LED symbol
|
|
5. Optimization of calibration plan registration
Toggle from calibration mode
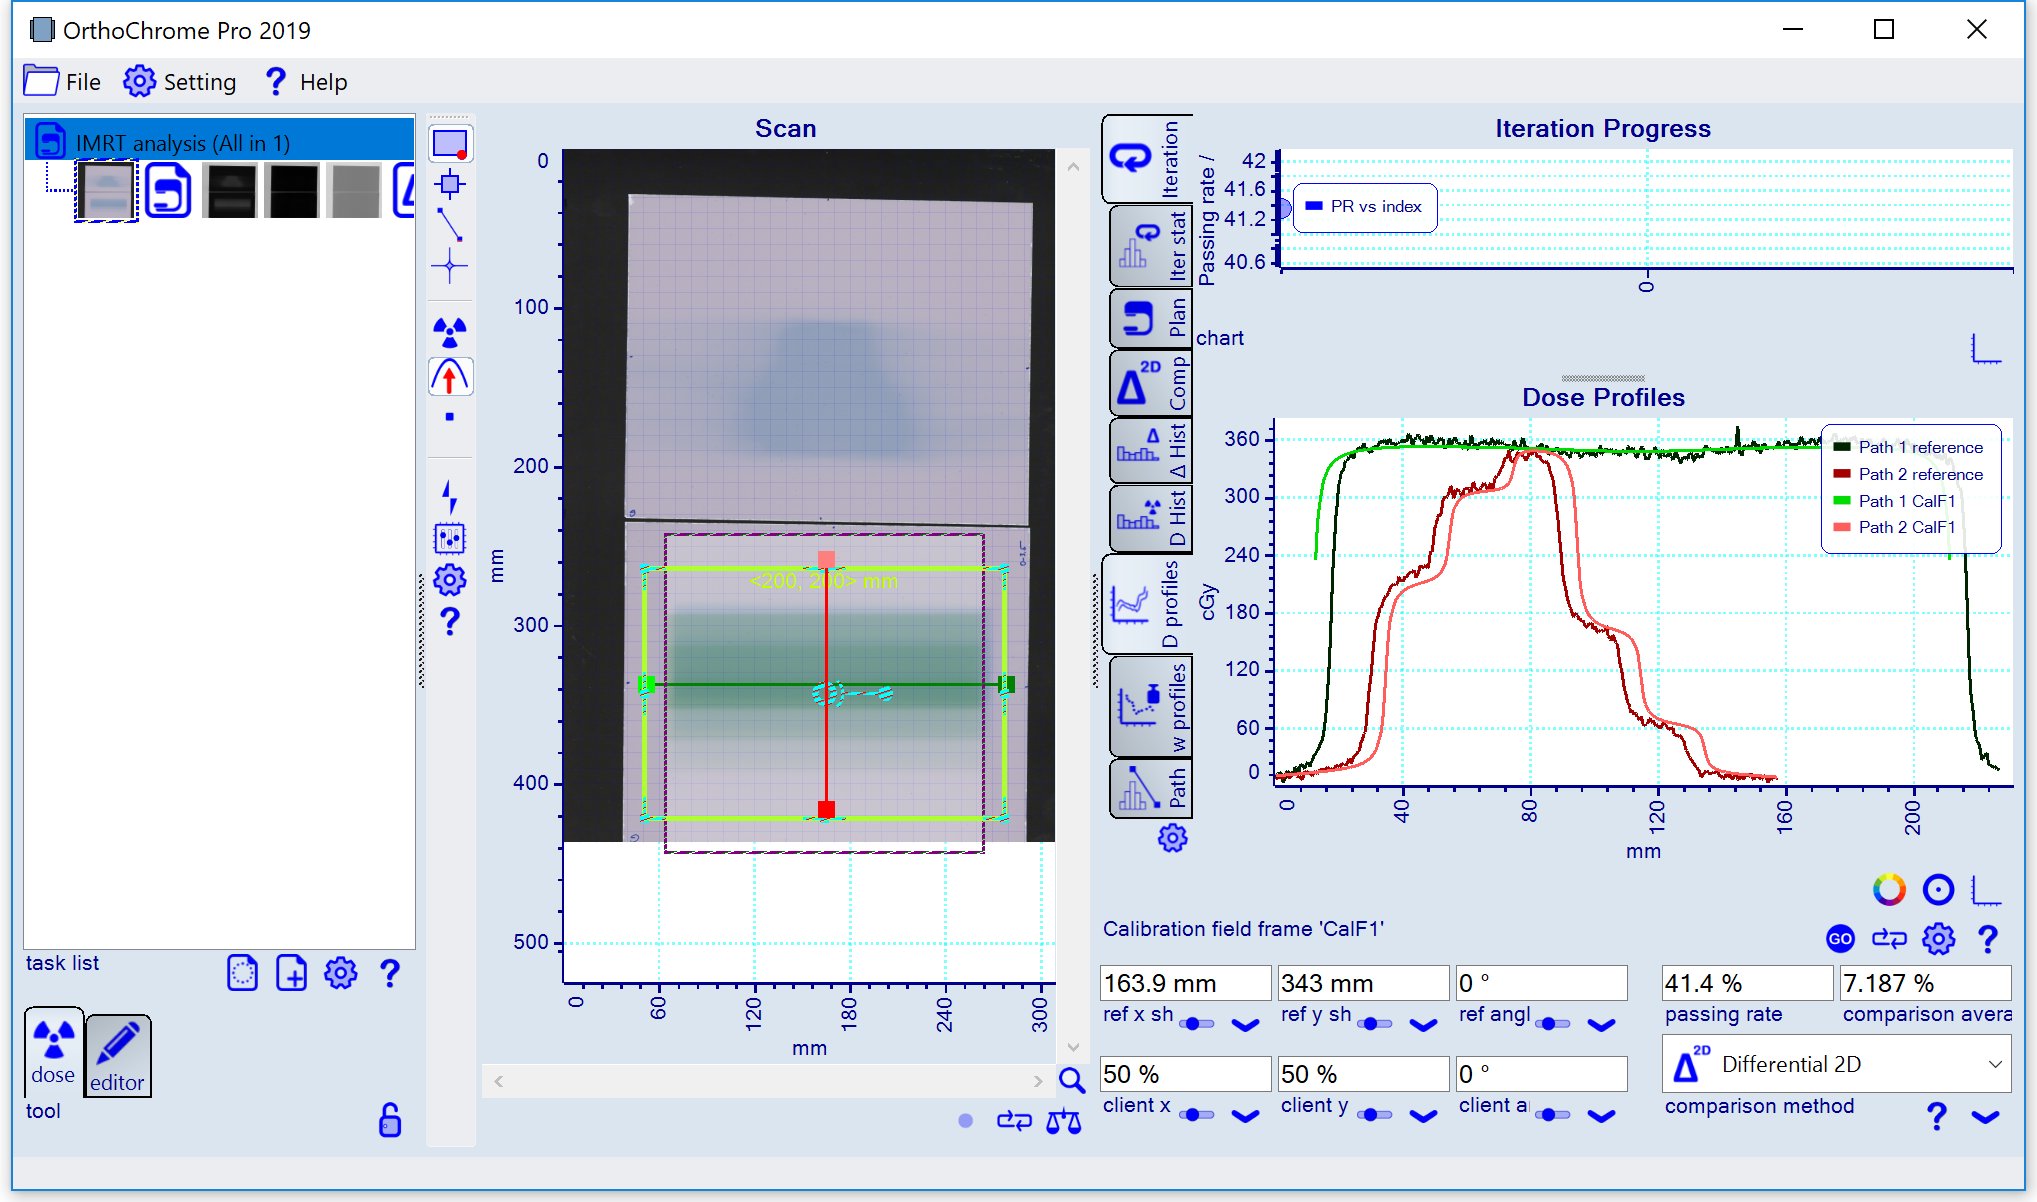
The 'comparison method' can be modified, e.g. to 'Gamma 2D' (use
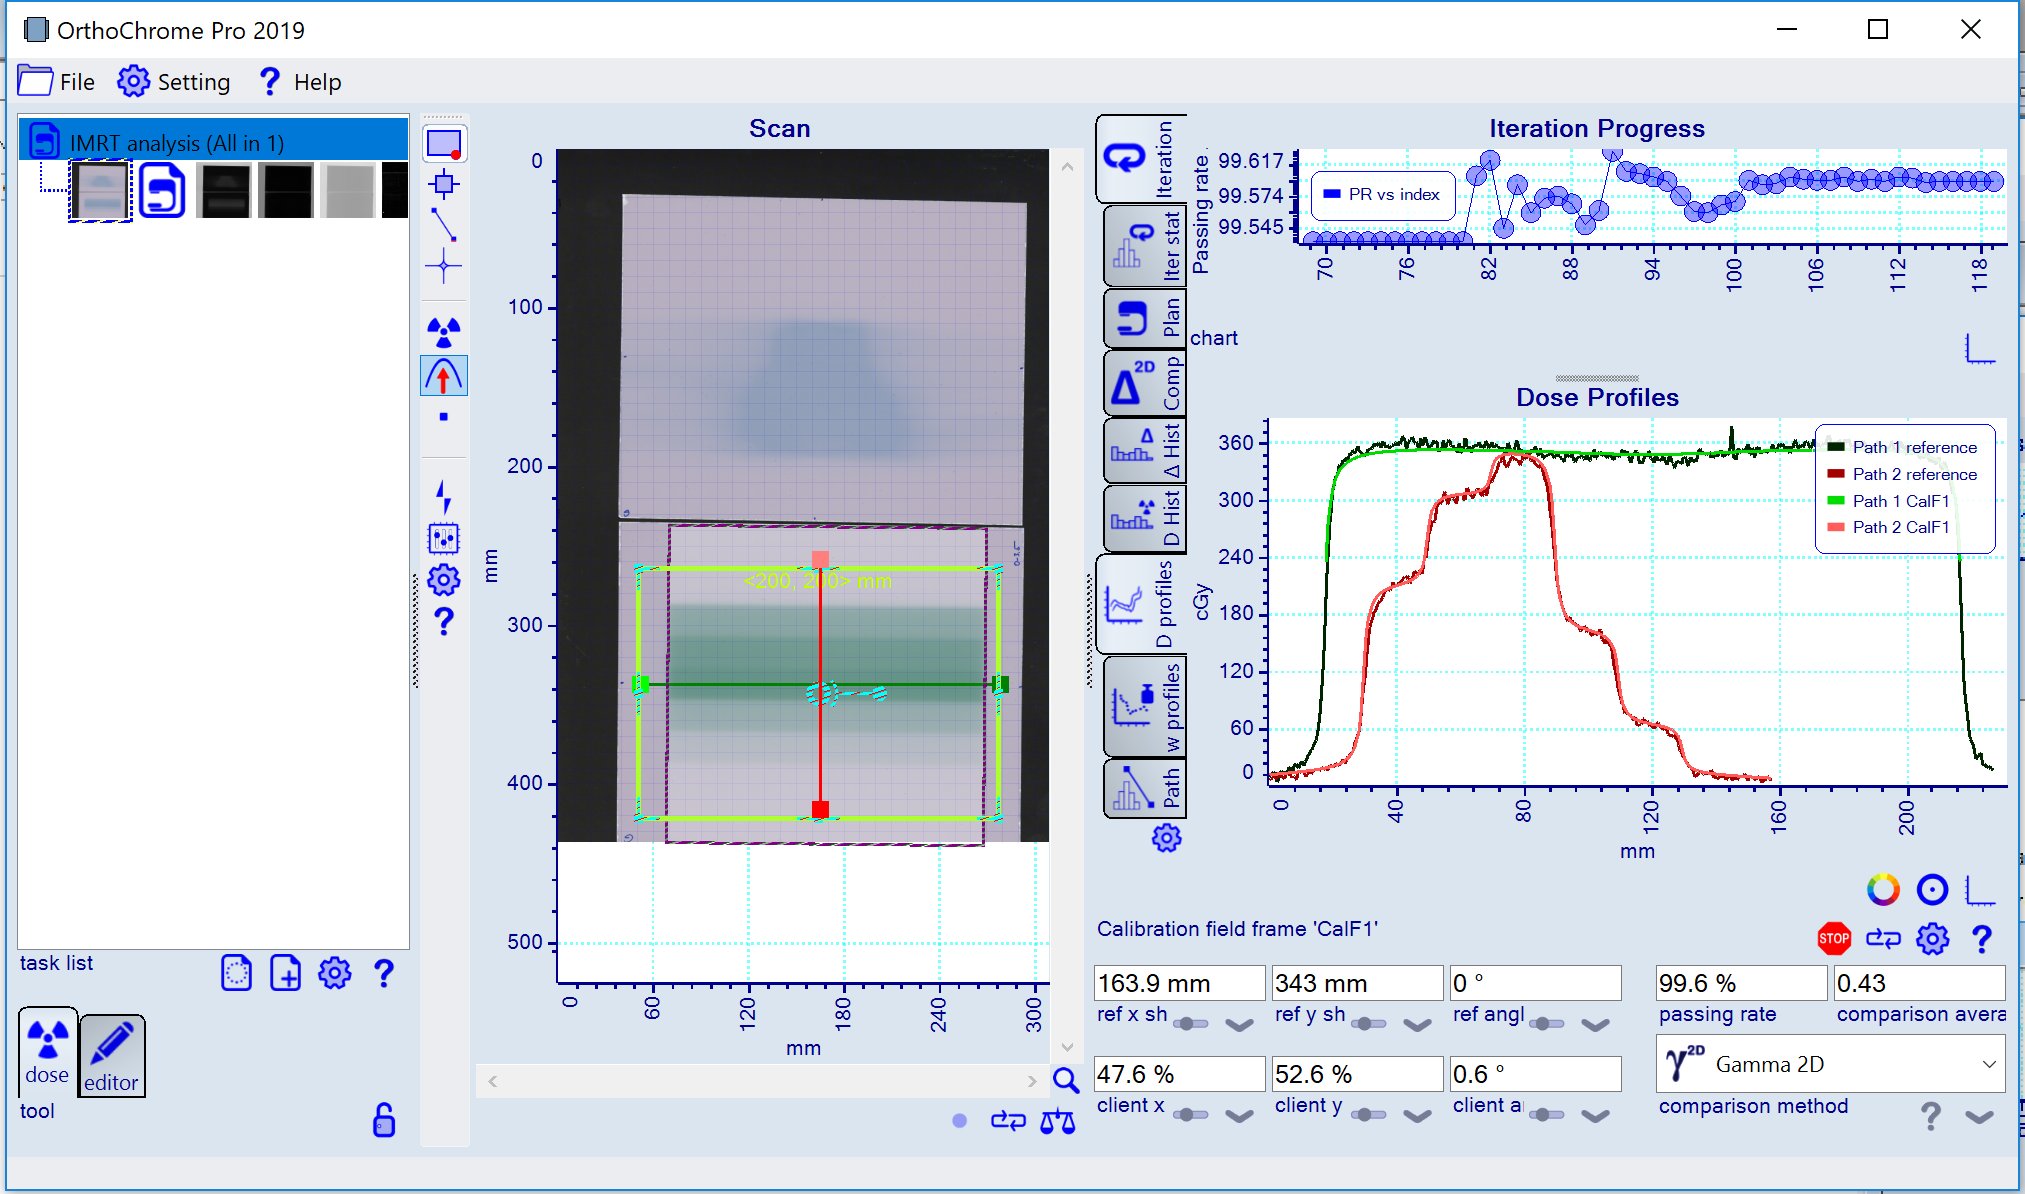
Stop the registration optimization when calibration data and calibration plan agree well enough by pressing the
|
|
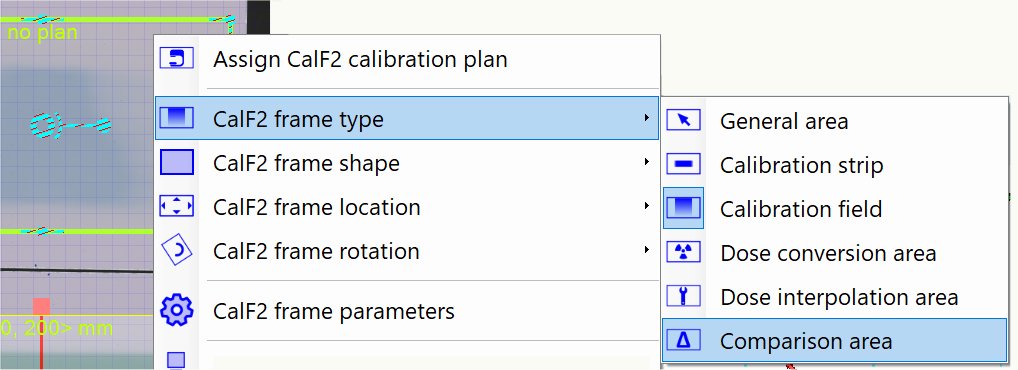
6. Comparison area and treatment plan assignment
Select frame tool
Change the frame type to 'Comparison area', right click inside the frame and select the type as shown below.
|
|
7. Optimization of treatment plan registration
To start the optimization of the treatment plan registration press the
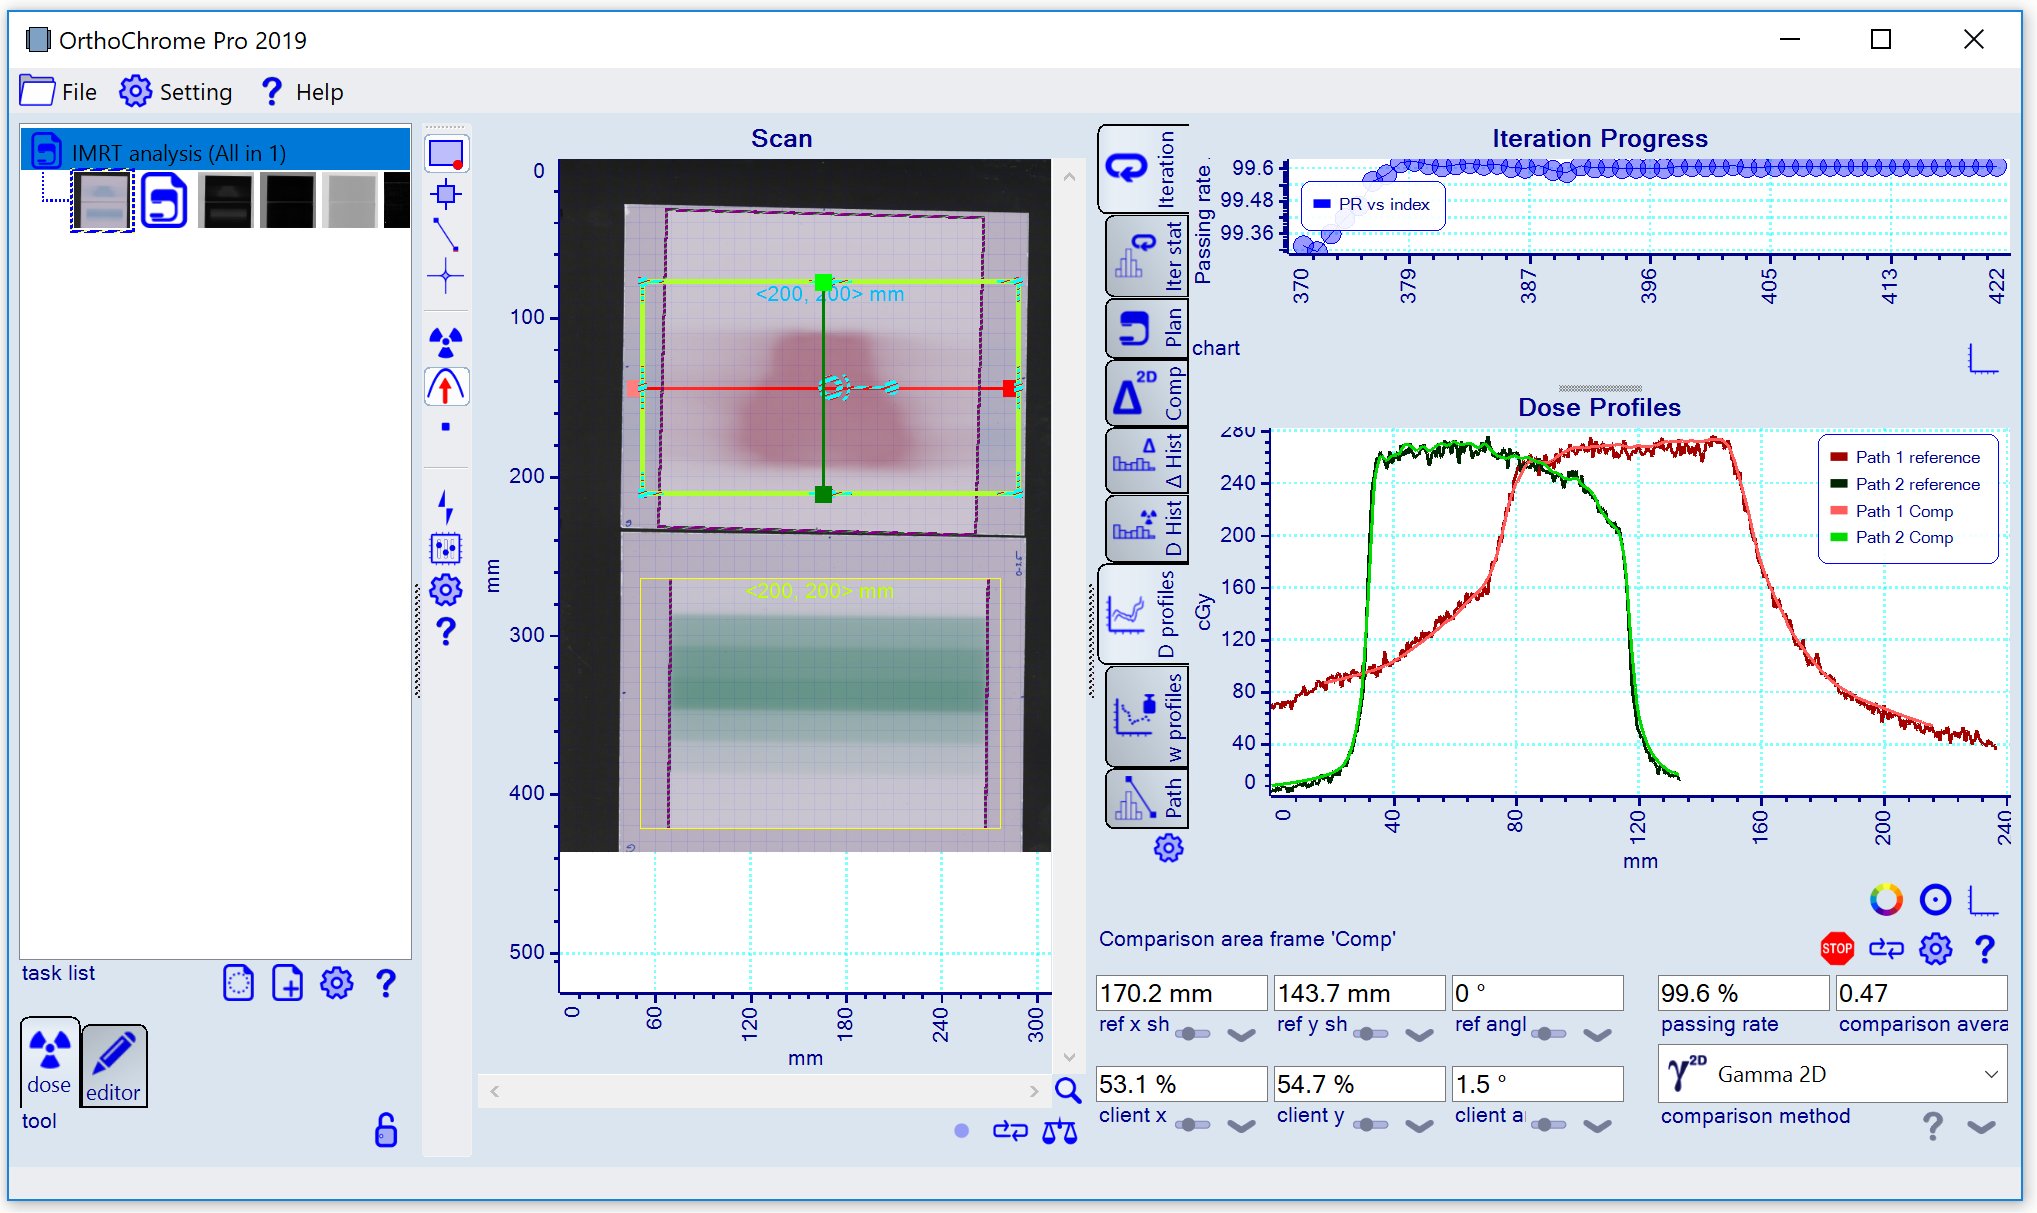
Stop the registration optimization when calibration data and treatment plan agree well enough by pressing the
|
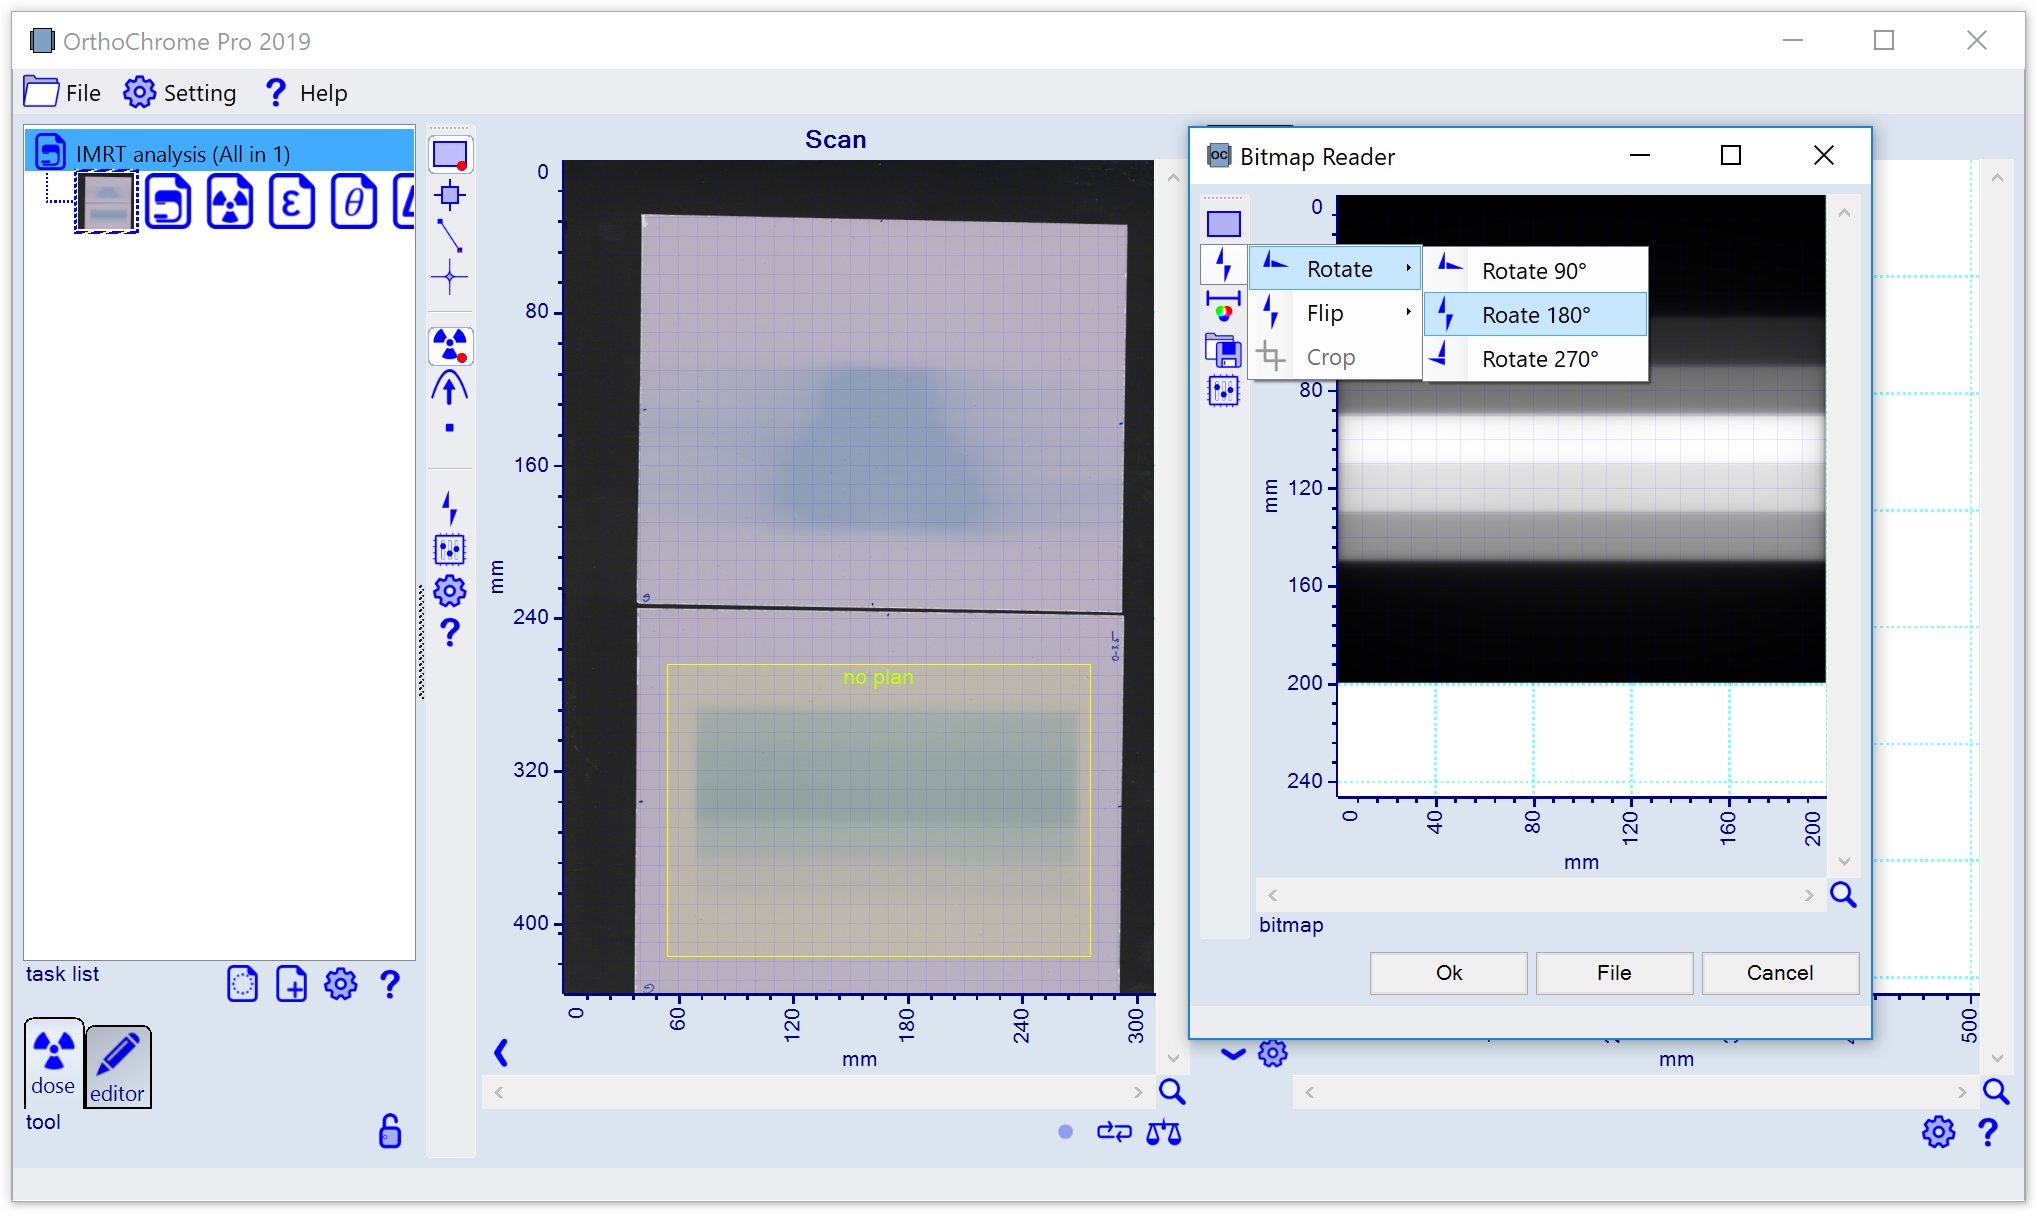
 and load the plan data 'Prostate 250 cGy Step Calibration 0-3.5 Gy Dose Plane.dcm' (use the filter 'DICOM - dcm (single image)').
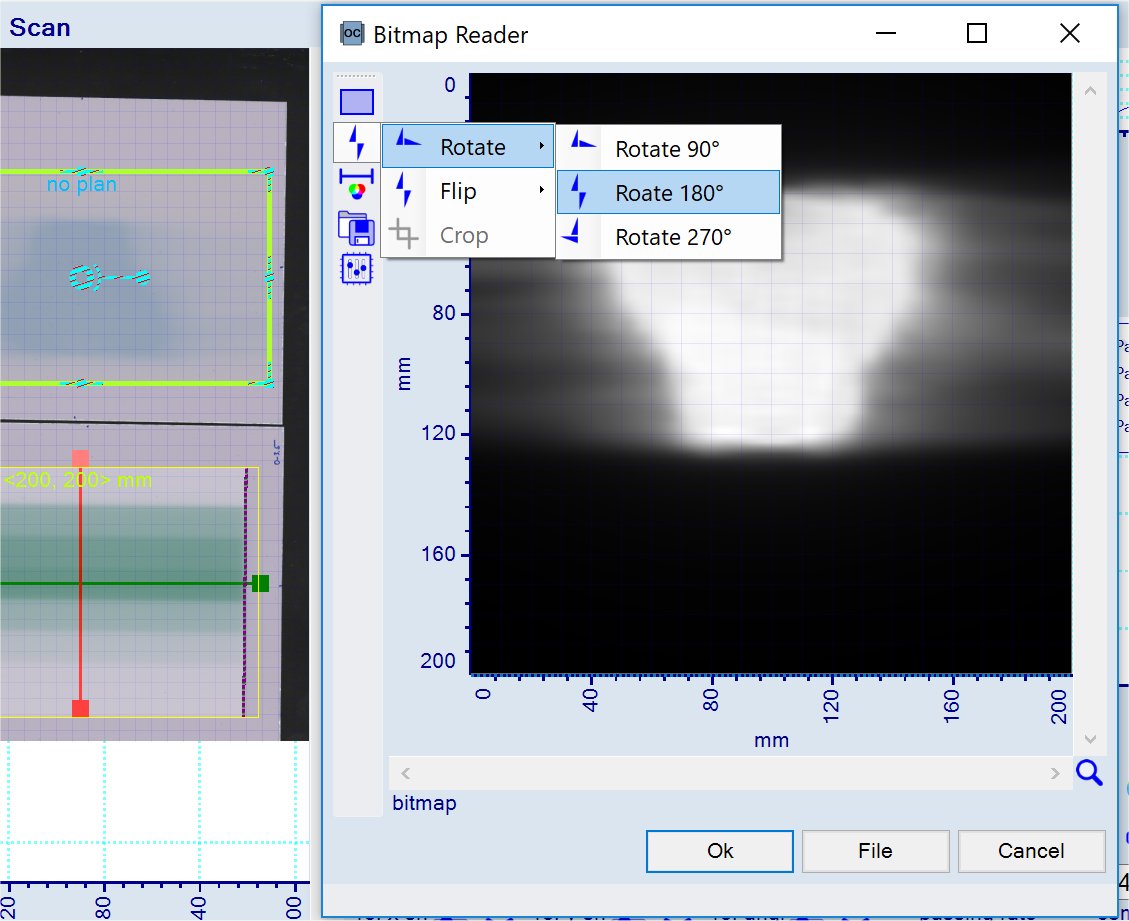
Note: The plan image needs to be rotated by 180° as shown below. Any quadrant adjustment (rotation, flipping), dose range scaling or cropping can be carried out in the 'Bitmap Reader' panel.
and load the plan data 'Prostate 250 cGy Step Calibration 0-3.5 Gy Dose Plane.dcm' (use the filter 'DICOM - dcm (single image)').
Note: The plan image needs to be rotated by 180° as shown below. Any quadrant adjustment (rotation, flipping), dose range scaling or cropping can be carried out in the 'Bitmap Reader' panel.
 underneath the center image. One can recalibrate at any time using the
 button.
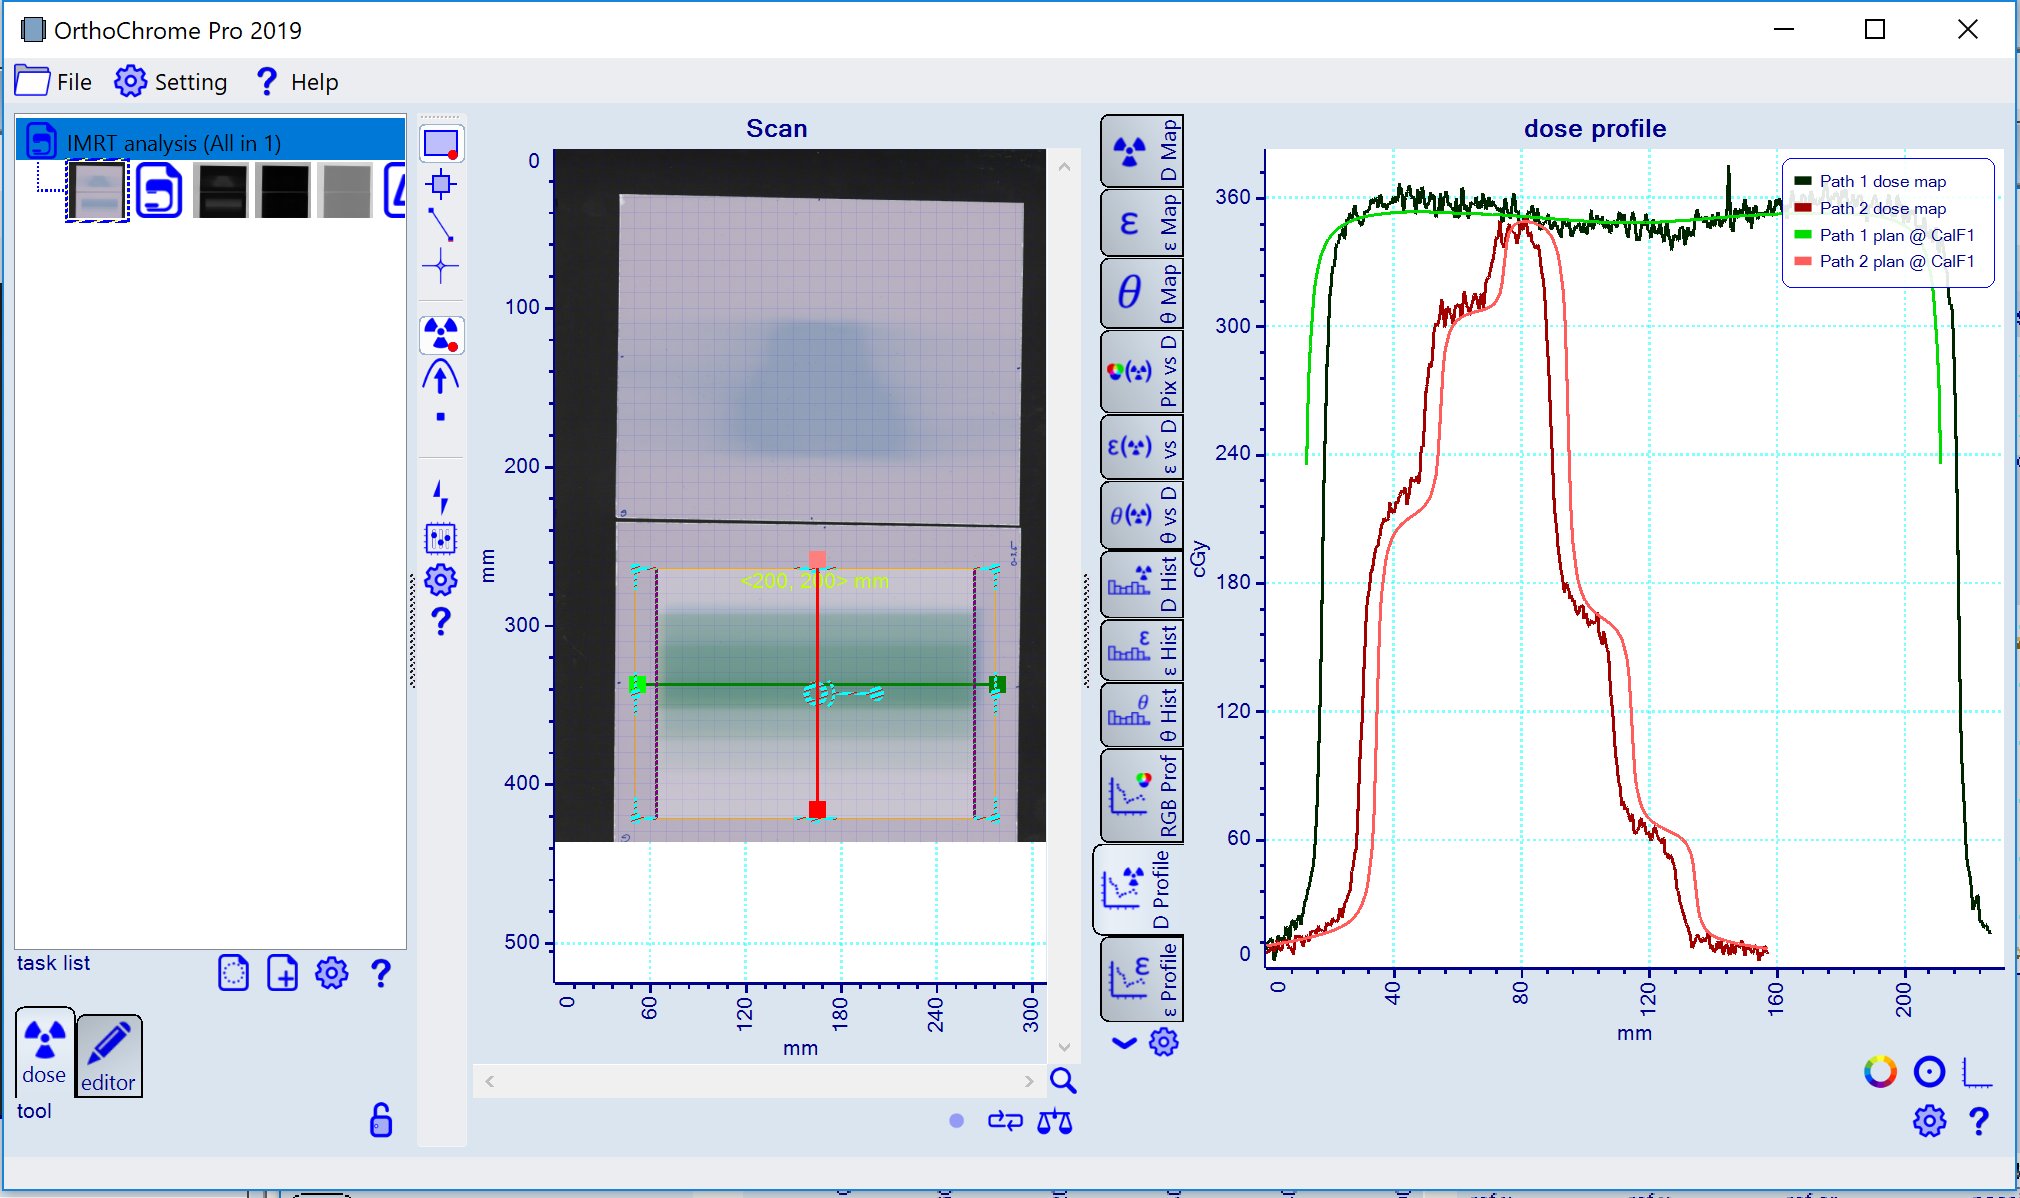
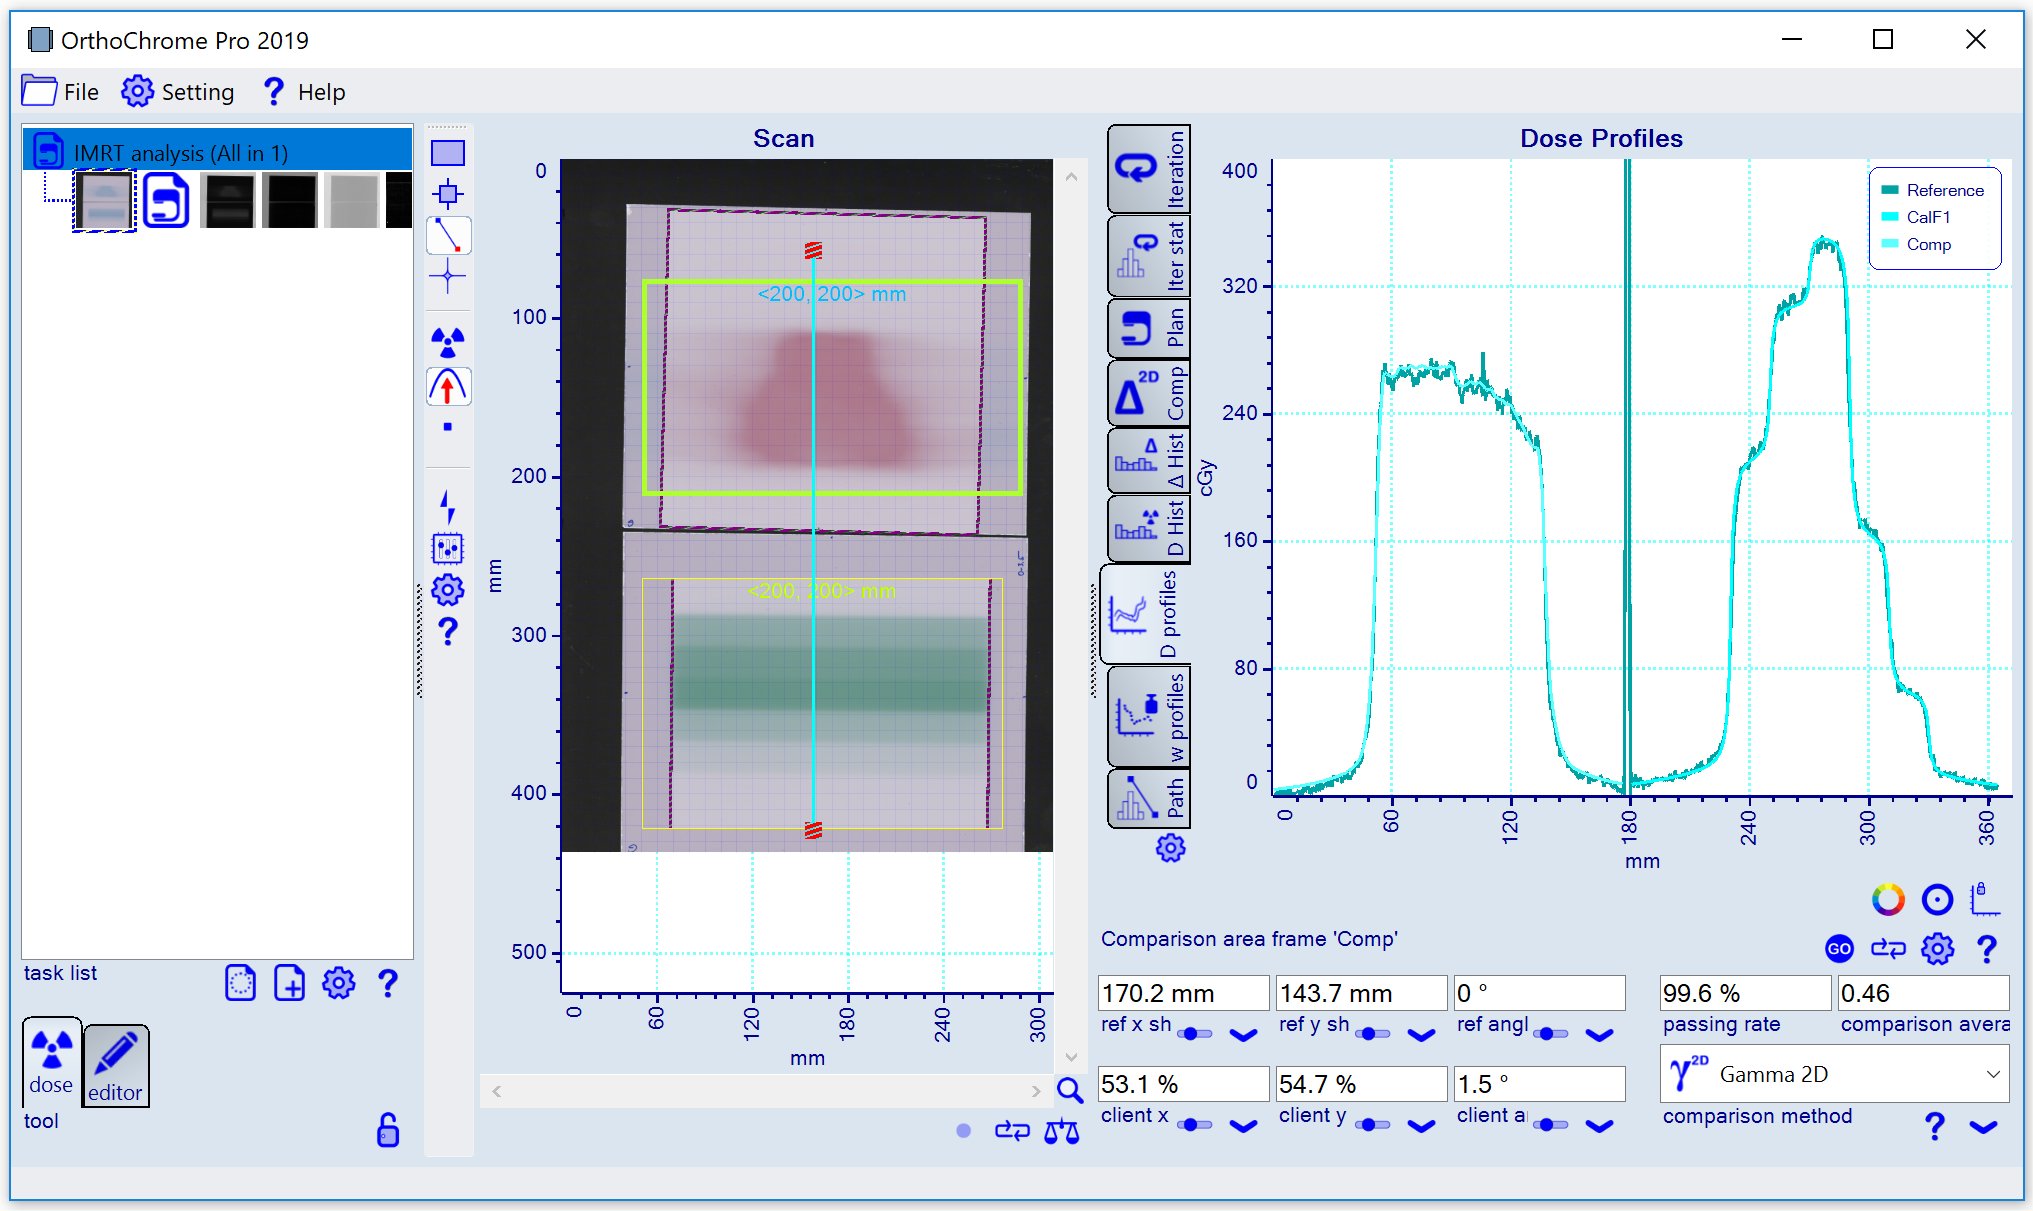
To profile the calibration data vs calibration plan assign a predefine paths by right clicking inside the calibration frame as shown below.
button.
To profile the calibration data vs calibration plan assign a predefine paths by right clicking inside the calibration frame as shown below.
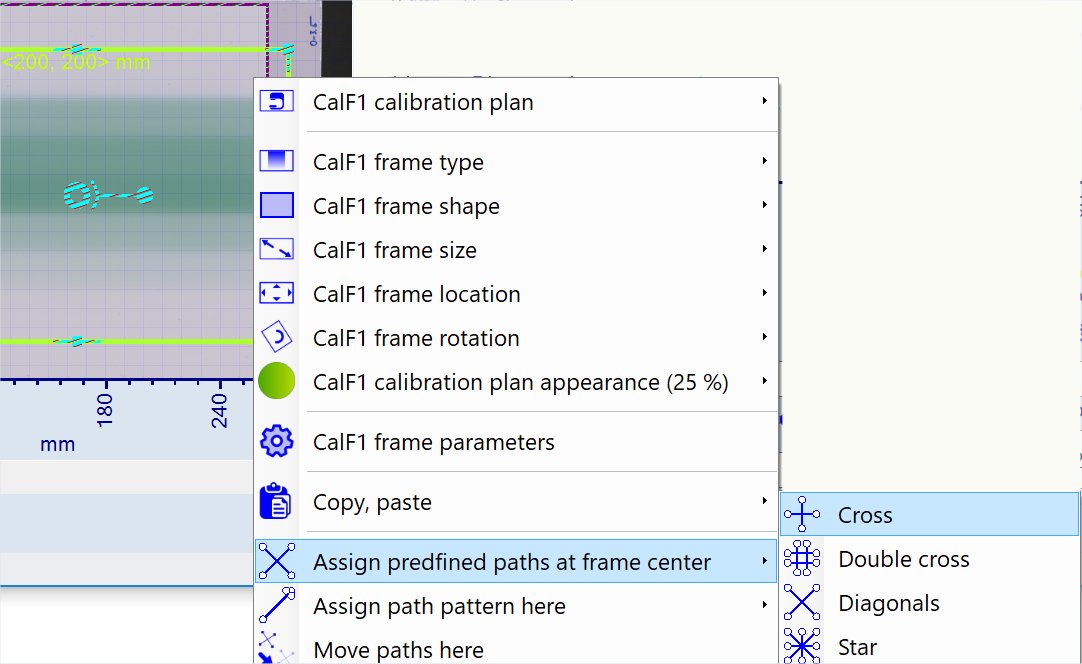 Select the 'Dose Profile' tab
 of the chart mosaic to get the display as shown below indicating that the registration of the calibration plan is not perfect yet.
 After the frame type is changed, a 'Load file' panel will pop up automatically to load the treatment plan data -
select the file 'Prostate 250 cGy Dose Plane.dcm' (use the filter 'DICOM - dcm (single image)').
The treatment plan can be changed any time by right clicking inside the comparison frame and using 'Assign treatment plan'.
Note: The treatment plan image needs to be rotated by 180° using the 'Bitmap Reader' as shown below.
After the frame type is changed, a 'Load file' panel will pop up automatically to load the treatment plan data -
select the file 'Prostate 250 cGy Dose Plane.dcm' (use the filter 'DICOM - dcm (single image)').
The treatment plan can be changed any time by right clicking inside the comparison frame and using 'Assign treatment plan'.
Note: The treatment plan image needs to be rotated by 180° using the 'Bitmap Reader' as shown below.
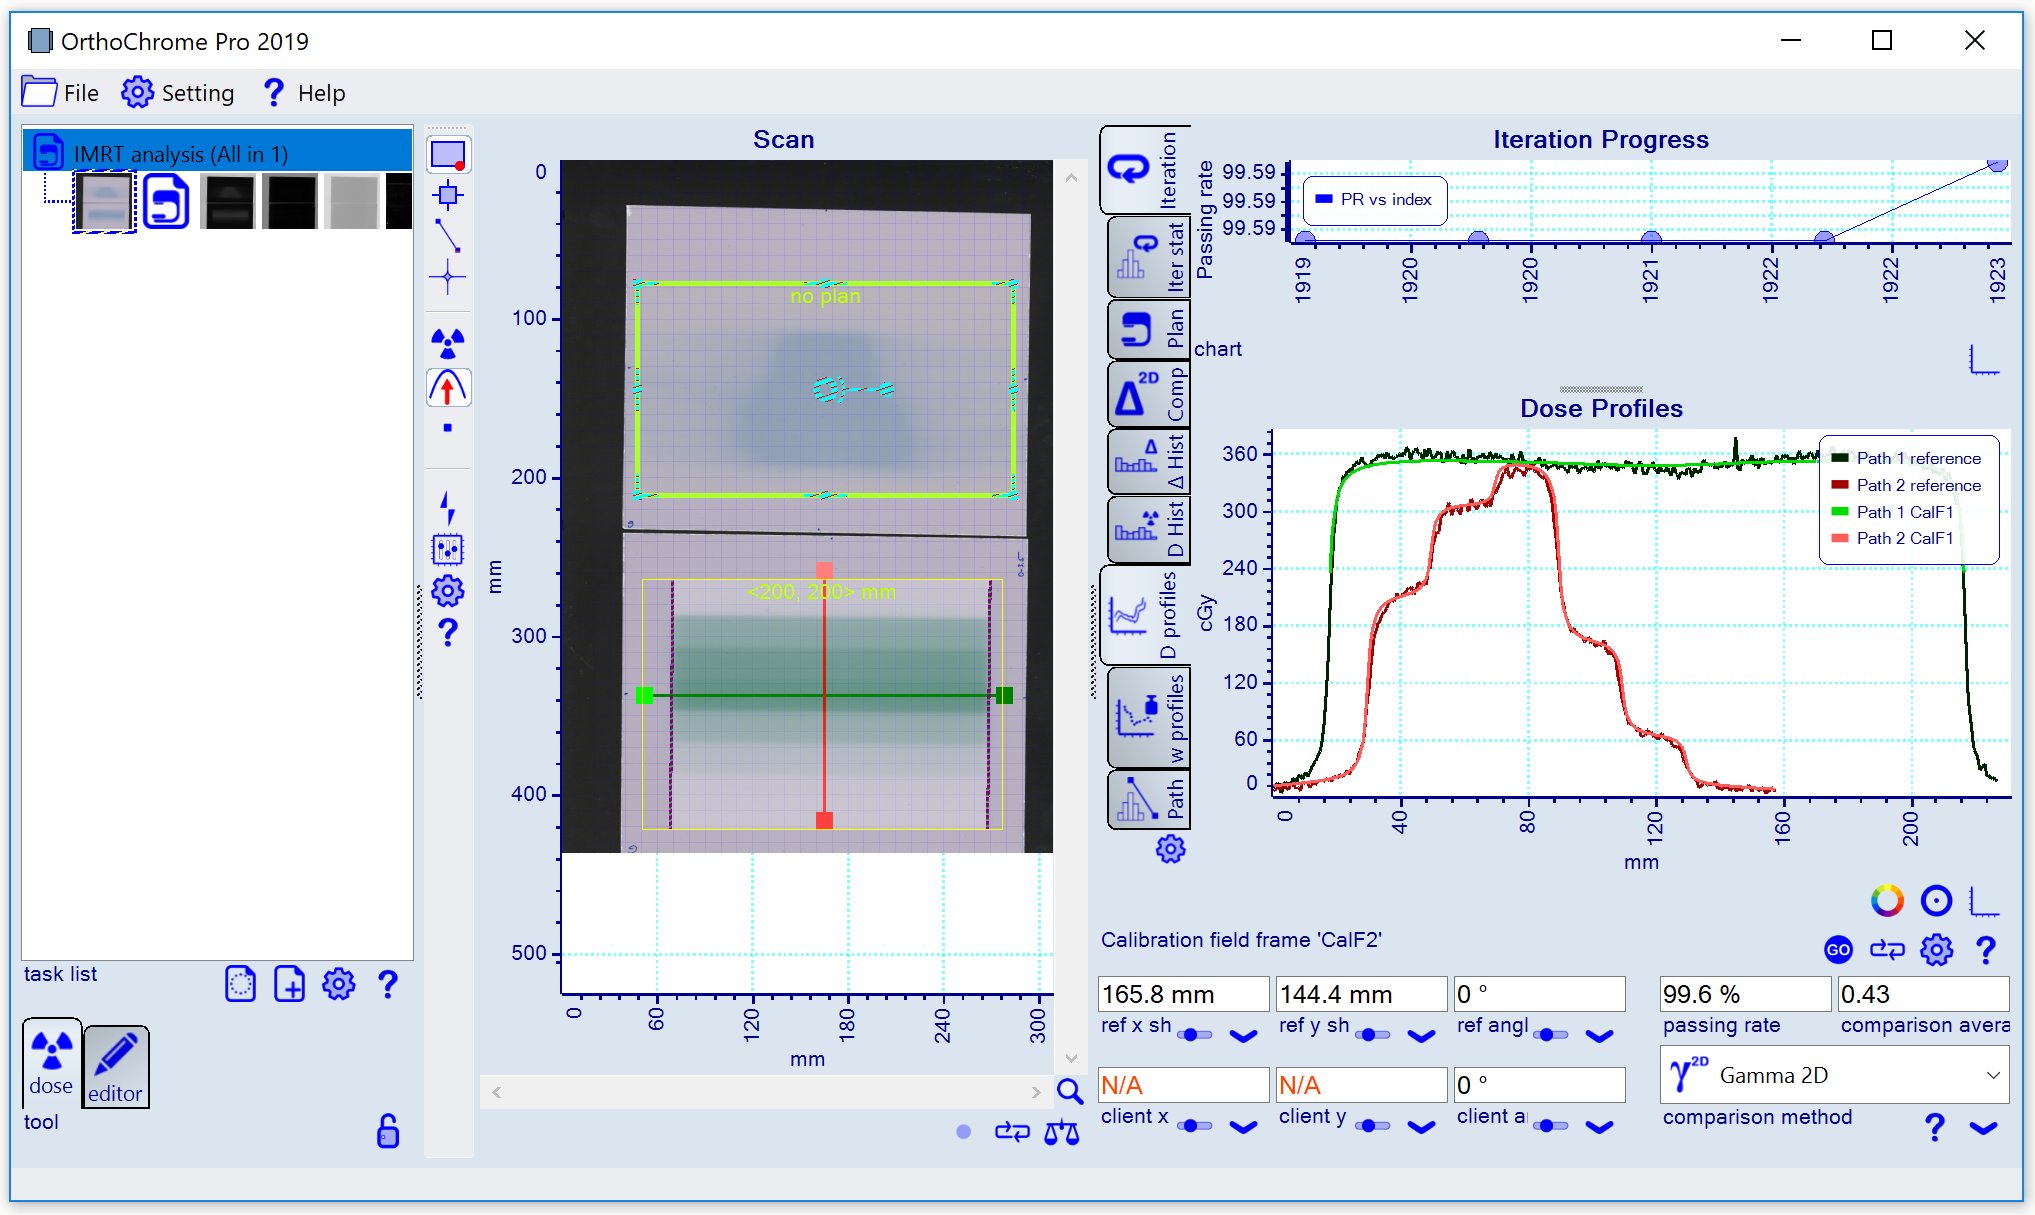
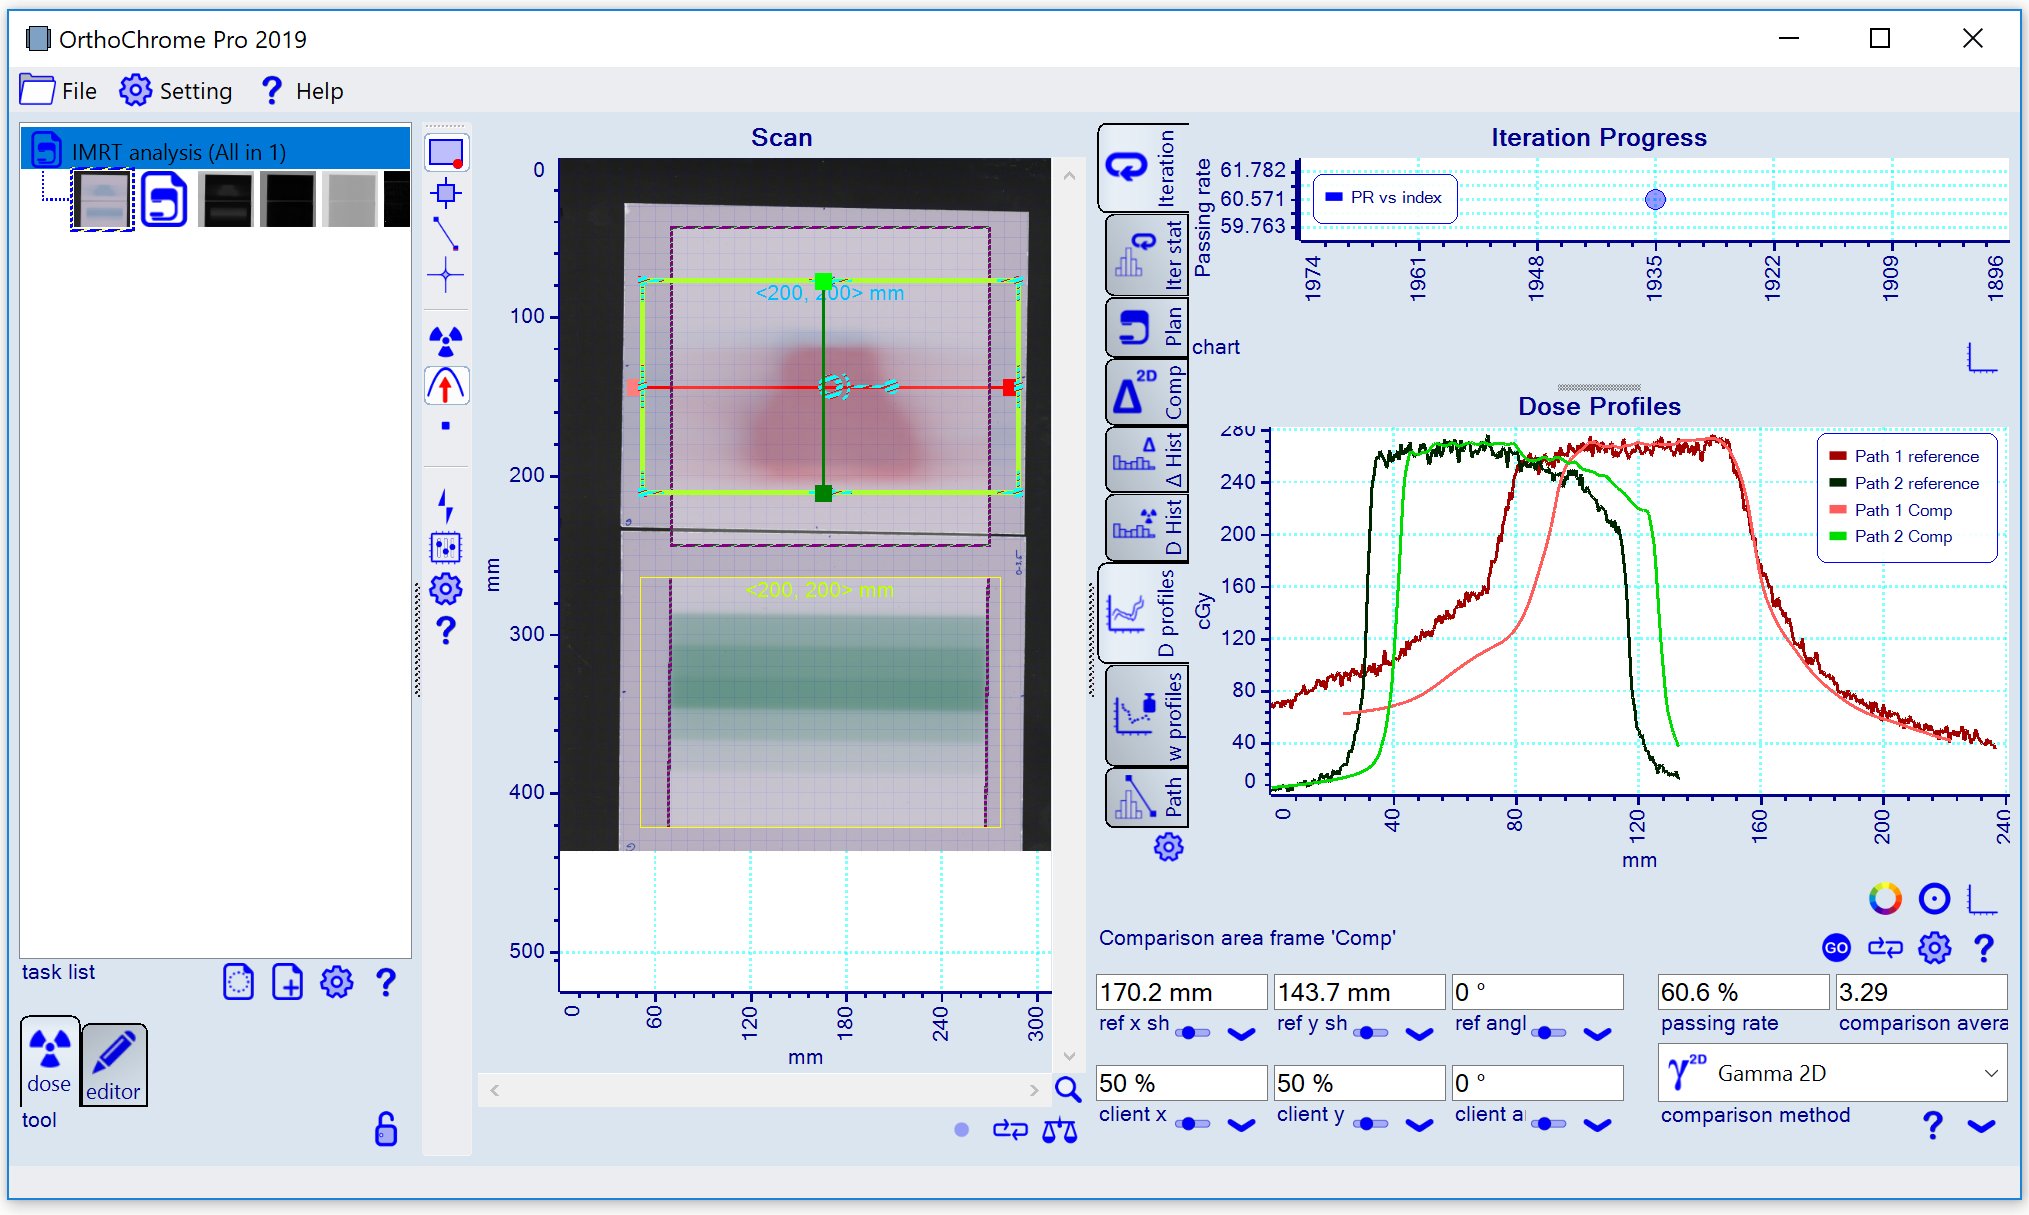
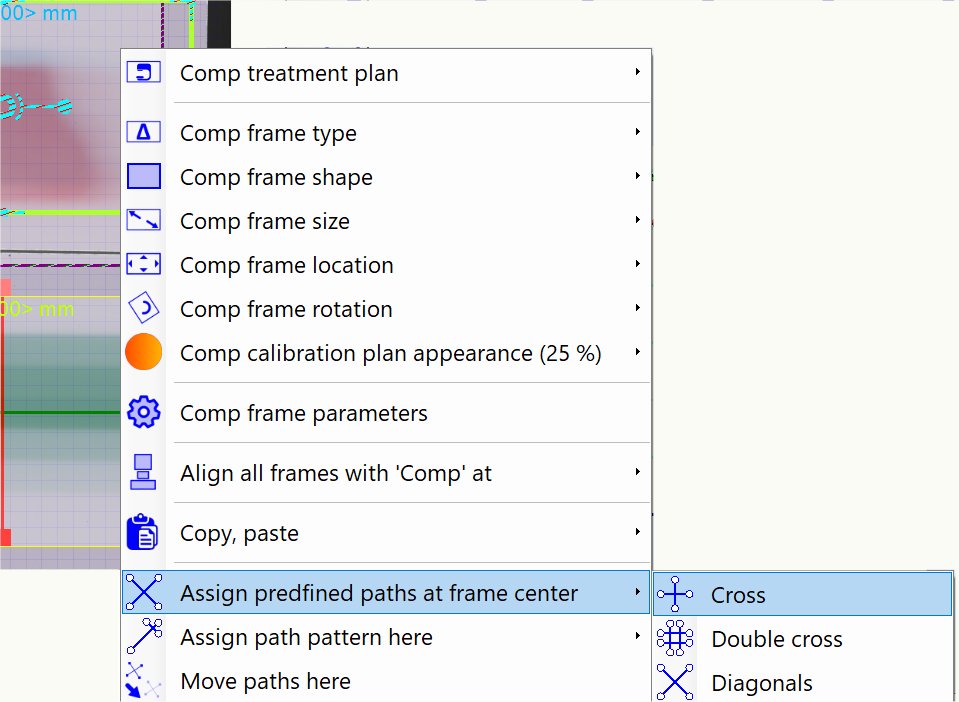
 Assign path pattern to comparison frame to profile dose vs plan data, use context menu as shown below.
 When the paths are assigned, the profiles dose vs treatment plan will look similar as shown below - since the plan registration is Not optimized yet,
there is a noticable profiles offset visible and the passing rate is still low.
When the paths are assigned, the profiles dose vs treatment plan will look similar as shown below - since the plan registration is Not optimized yet,
there is a noticable profiles offset visible and the passing rate is still low.
-- end of document --